What is the ‘Moving Average Convergence Divergence – MACD‘. Moving average convergence divergence (MACD) is a trend-following momentum indicator that shows the relationship between two moving averages of prices.

The MACD is calculated by subtracting the 26-day exponential moving average (EMA) from the 12-day EMA. A nine-day EMA of the MACD, called the “signal line”, is then plotted on top of the MACD, functioning as a trigger for buy and sell signals. Below are 10 Most Easy and Accurate Forex MACD Trading Systems.
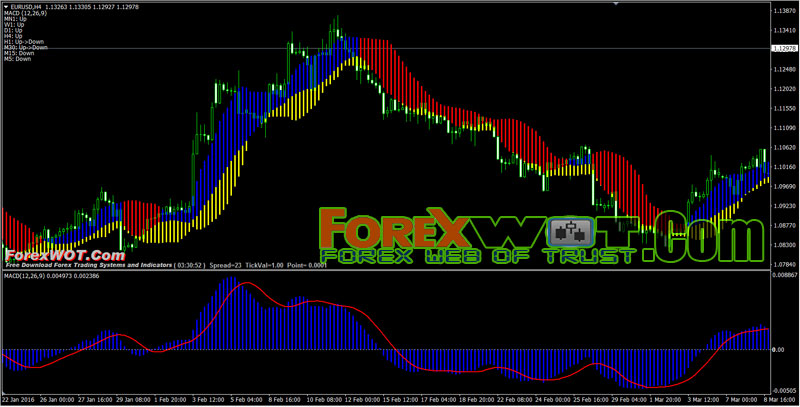
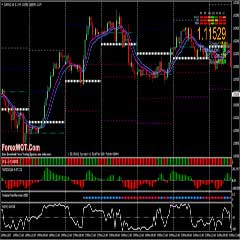
1. Track Trend MACD
This system is an effective combination of indicators to boost your profit making abilities in the market. This system is really good because of its simplicity, versatility, and credibility.
The rules of this system are straightforward and easy to follow, and there’s no need for guesswork in this system. That makes this system very simple.
The system is credible. Most of the time, it doesn’t give false signals. About 90% of the time that I use this system, I am able to hit my targets.
[sociallocker]
[/sociallocker]
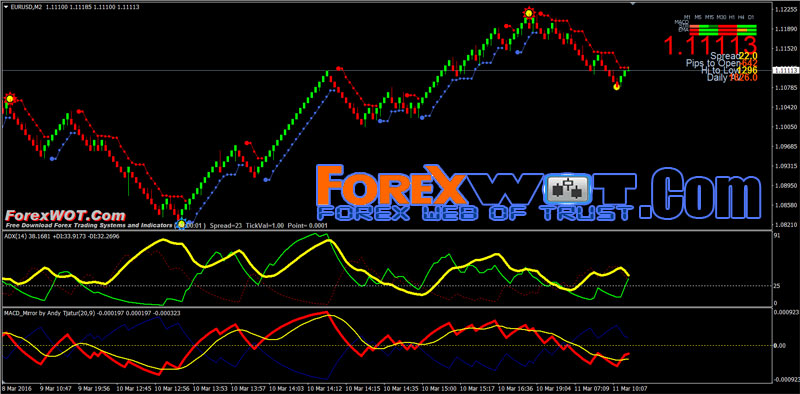
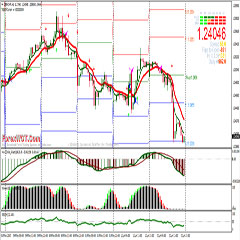
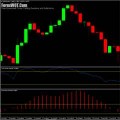
2. Renko MACD Mirror Trading System
A Renko chart is a type of chart. developed by the Japanese, that is only concerned with price movement; time and volume are not included. It is thought to be named for the Japanese word for bricks, “renga”.
A renko chart is constructed by placing a brick in the next column once the price surpasses the top or bottom of the previous brick by a predefined amount. Green bricks are used when the direction of the trend is up, while red bricks are used when the trend is down.
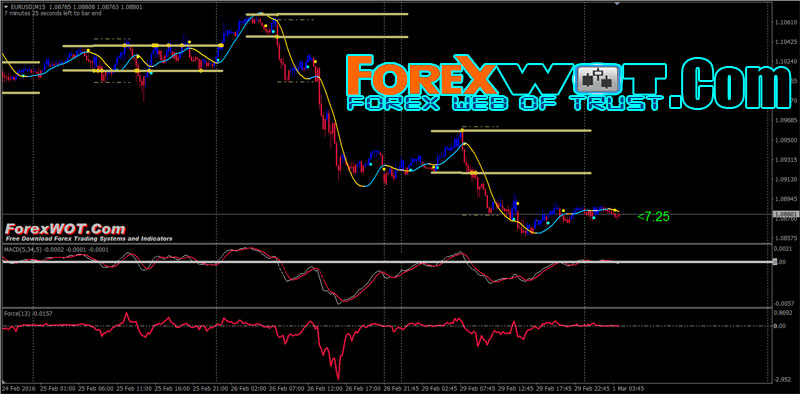
3. Double MACD Support Resistance Trading
Forex Double MACD Support Resistance is a trend-following forex trading system. The Double MACD settings are 5 exponential moving average (EMA), 34 exponential moving average (EMA), and 5 signal simple moving average (SMA).
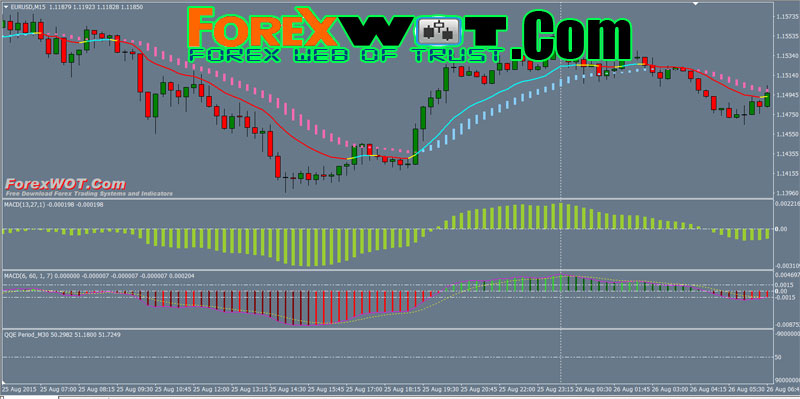
4. Heiken Ashi with Multi MACD and QQE
This is a trend following trading system based on the Smoothed Heiken Ashi MA, MACD indicator with QQE indicator filter MTF.
Best Time Frame : 15min or above.
Trading Sesssion: from 7 until 17 GMT + 0:00
Pairs traded: Eur Usd , Gbp Jpy ,Gbp Chf Eur/Jpy , Aud/Usd and Gbp/Usd.
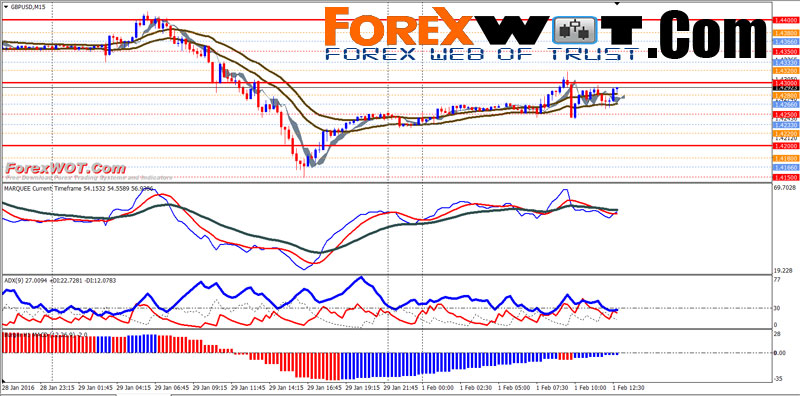
5. Multi MACD Ichimoku Trend Trading
MACD stands for moving average convergence divergence and it’s a trending and momentum indicator. The indicator uses a MACD line, a signal line, and a histogram. A signal line is actually a moving average of the MACD line itself. Convergence occurs when the two lines move towards each other, and divergence occurs when they move away from each other.
Forex Multi MACD Ichimoku Trend Trading Best Time Frame : 15 Minutes, Currency pairs : any.
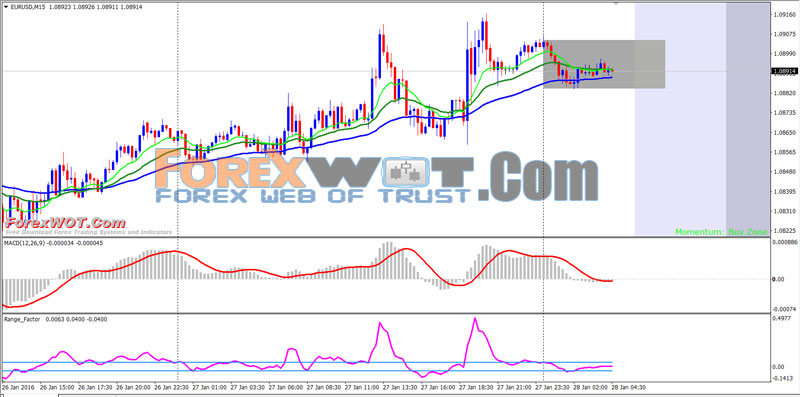
6. Forex EMA Trend Trading with MACD and Range Factor
Trend following trading strategy is an investment strategy that tries to take advantage of long-term moves that seem to play out in various markets. The strategy aims to work on the market trend mechanism and take benefit from both sides of the market, enjoying the profits from the ups and downs of the finacial markets.
The main rules of Forex EMA Trend Trading with MACD and Range Factor – The main time frame we are going to watch is the 1-Hour time frame. After confirming the trend (Neo EMA Trend, EMA 26, and EMA 20), we will look to 5-min chart for entering and exiting a position. You can also trade the 15-minute time frame with 5-minute chart to determine your entries.
Exponential Moving Average as Trend Indicator
55-EMA; using weighted moving average, we can identify the immediate trend faster than a Simple Moving Average. This is one of the important indicators in the FB system as it will tell us whether to enter long or enter short.
MACD Oscillator & Range Factor
FastEMA 12, SlowEMA 16 and SignalSMA 9 – this oscillator will helps traders to identify market momentum and thus creates entry signals. Divergence is the most effective early sign that the movement is going to reverse. Range Factor will also helps trader to identify and thus creates entry signals.
Power Hours
These hours (0700 GMT – 1800 GMT) are especially volatile because it eclipses at least two major foreign exchange markets from the Asians to the Europeans then the Americans.
Trading Pairs
GBP/USD and EUR/JPY. Although it seems that most of the majors and crosses worked well, but I did not try with other pairs so please do a demo first because going live on other currency pairs.
7. Multi Bollinger Bands Stop with Kinjun Sen and MTF MACD
The strategy uses four BBands Stop indicators and some pretty well known custom indicator. In this strategy it ( BBands Stop indicators ) will be used primarily as a trend identifier. We will only take trades in the direction of the trend so BUY in an uptrend and SELL in a downtrend.
And MACD is one of the most reliable indicators. Although we do not believe in using any indicators in our own trading and we always use the candlesticks charting and Bollinger Bands Stop to find the trade setups, still we believe that MACD is a strong indicator specially for novice traders who are used to get in and out of the market too early.
MACD is a lagging indicator and its delay makes you be patient, not to rush to enter the market or get out of it too early.

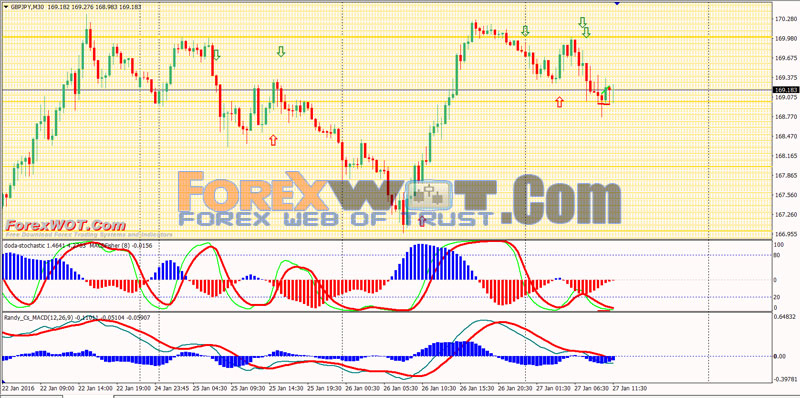
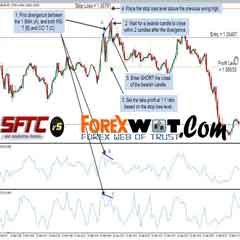
8. Forex MACD Divergence Trading
This Works on All Time Frame MACD divergence trading system is based on two divergence indicators and works on the all time frame. Here I show how it work at the time frame 30 min. Best trading session: London and New York.
Metatrader indicators:
- Sweet Spot,
- MACD Fisher,
- FXCX Divergence indicator (5,13,21,),
- MACD Divergence indicator (12, 26 9),
- Doda Stochastic indicator ( 5,13, 5 setting for 5 min and 15 min time frame, for other time frame the setting is 5, 8, 5).
9. Multi Bands with Double MACD and Laguerre
You don’t have to know the weak and strong candlestick patterns and differentiate them from each other. You don’t have to know anything about complicated technical analysis.
Best Time Frames: 30 MIN or Higher
Use this system during London and New-York Sessions or all sessions. Keep Away from High Impacted News.
Currency Pairs: All Major Pairs

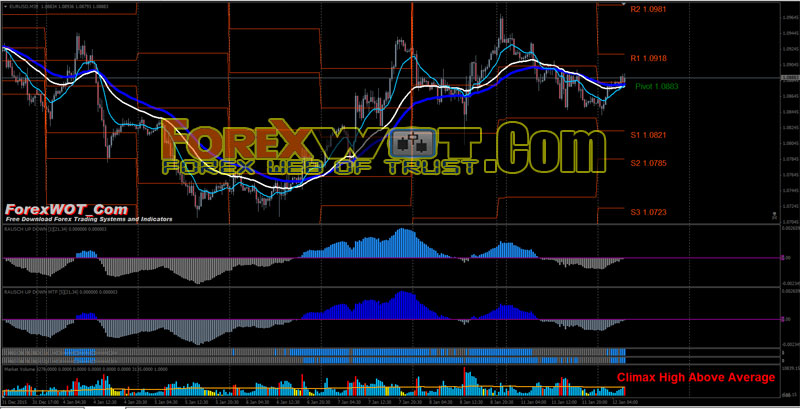
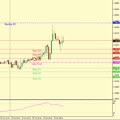
10. Pivot Point Support Resistancewith Market Volume and MACD
Volume is required to move a market, but it’s a particular type of volume that really matters: institutional money, or “smart money,” which is large amounts of money being traded in a similar way, thus affecting the market greatly.
Only volume shows when price is being affected by this type of activity. Knowing how institutional money operates, we are able to track those traders and trade along with them, so that we’re swimming along with the proverbial sharks rather than being their next meal
Trading requires reference points (support and resistance), which are used to determine when to enter the market, place stops and take profits.
Many strategies can be developed using the pivot level as a base, but the accuracy of using pivot lines increases when Japanese candlestick formations can also be identified.
For example, if prices traded below the central pivot (P) for most of the session and then made a foray above the pivot while simultaneously creating a reversal formation (such as a shooting star, doji or hanging man), you could sell short in anticipation of the price resuming trading back below the pivot point.
And this Forex Pivot Point Support Resistance Trading System with Market Volume and MACD Indicator is highly effective Pivot trading system.
BREAKING DOWN ‘Moving Average Convergence Divergence – MACD’
There are three common methods used to interpret the MACD:
- Crossovers – As shown in the chart above, when the MACD falls below the signal line, it is a bearish signal, which indicates that it may be time to sell. Conversely, when the MACD rises above the signal line, the indicator gives a bullish signal, which suggests that the price of the asset is likely to experience upward momentum. Many traders wait for a confirmed cross above the signal line before entering into a position to avoid getting getting “faked out” or entering into a position too early, as shown by the first arrow.
- Divergence – When the security price diverges from the MACD. It signals the end of the current trend.
- Dramatic rise – When the MACD rises dramatically – that is, the shorter moving average pulls away from the longer-term moving average – it is a signal that the security is overbought and will soon return to normal levels.
Traders also watch for a move above or below the zero line because this signals the position of the short-term average relative to the long-term average. When the MACD is above zero, the short-term average is above the long-term average, which signals upward momentum. The opposite is true when the MACD is below zero. As you can see from the chart above, the zero line often acts as an area of support and resistance for the indicator.
 2 MACD Effortless Forex & Stocks Swing Trading Strategy
 FREE DOWNLOAD 20+ Best Forex MACD-Moving Average Trading System
 Forex M30 H1 Time Frame Trading: High Accuracy Pivot All Levels Trading With Daily Weekly Open Trading System
 Best H1 Forex Pivot Points Levels Trading Strategy Based on MACD, AFL Winner, RSI, and EMA indicator
 5 Minute Chart Surefire RSI-CCI Forex Trading System and Strategy
 MACD RSI Trading – The Easiest Way To Measure Forex Reversal Breakouts
 FOREX 1 MIN Scalping Trading Tricks By The Most Successful Forex Trader
 Forex Multi Time Frame Pivot Points Trading and Investment Strategy
 Foreign Exchange Trading : Online Forex Master Level Trading System and Strategy
 MA COBRA Forex & Stocks Trading Strategy (Extremely Low Risk High Reward Trading Strategy) (COBRA SYSTEM)

No download link for System No. 1 above?