As a professional trader spending hours on hours per week looking at charts, you start to develop a technical vision which unconsciously lets you see cardinal points in the market, overlooked by the untrained eye.

For several years, I have been following a certain pattern in the market which produces over 80% winning trades every time I apply it.
After working with it manually for several years and taking very nice profits from the market, I have started the phase where I am trying to automate my rules of trading as much as I can.
My belief is (and it’s almost certainly a fact) that there are certain strategies, especially the most accurate ones, which simply cannot be converted into 100% automated without losing accuracy and the Pips Carrier is one of them.
However, using available technology in a smart way allows you to mediate this deficiency and achieve at least 95% automation.
A late night dinner with a dear friend led me to a decision.
“Why not publish it and let others enjoy it as well, and, more importantly, profit from it?” His enthusiasm convinced me.
In addition, releasing this system goes hand in hand with my primary goal, which is to increase the level of trading for many traders out there.
With the help of my trading tools, I have created for you (well, Marina coded it so she deserves some credit), the Pips Carrier, which turns out to be a piece of cake even for beginners, allowing them to produce amazing results right from the start.
My belief is that even a trader who uses technical analysis must understand the basics of the indicator he uses in his day to day trading.
The first indicator I want to talk about is the MACD indicator. MACD stands for Moving Average Convergence Divergence. It is a very important indicator. Unfortunately, I don’t know a lot of traders who have an in‐depth understanding of the importance of this indicator, and even fewer traders who use it as they should.
The MACD indicator is considered by many, including myself, to be one of the most reliable of all the existing indicators in technical analysis—when used correctly (which is what I’m here for).
This indicator has been developed by Gerald Appel, who is considered a classic technical analysis guru.
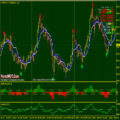
The MACD indicator consists of 2 moving averages and a histogram.
This is what it looks like:

The BLUE average is the short period average and the RED average is the long period average.
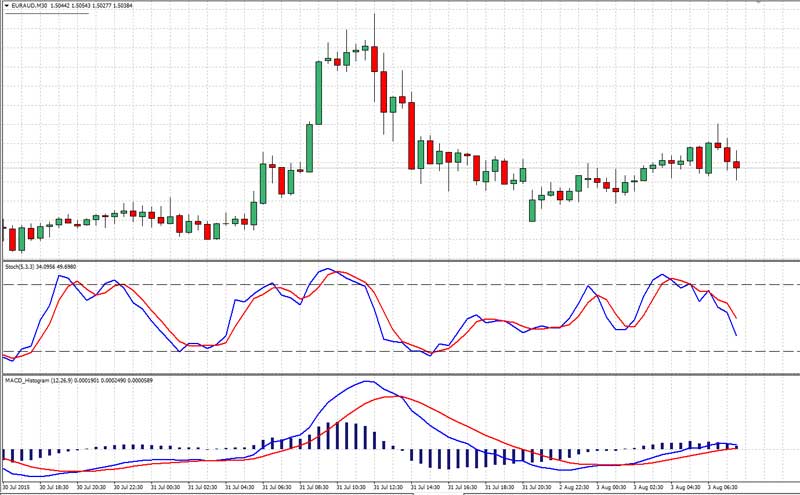
Note: the MACD Complete indicator included with the Pips Carrier installation is NOT the same as MetaTrader’s built in MACD. The one you got with Pips Carrier follows the classic form of the MACD.
The histogram (the vertical bars you see below the lines) represents the difference between the two averages. Zero level is the most important level of this histogram. This is a test level.
When the histogram is above zero level, the currency is on an uptrend.
When the histogram is below zero level, the currency is on a downtrend.
Let’s look at the following chart and analyze it:

You notice that the histogram consists of several slopes. A histogram’s slope determines the current direction of the market. If a histogram is above zero level and its slope is facing down, this is a sign that the market is expected to decline.
If a histogram is below zero level and its slope is facing up, it means that market is likely to go up.
Let’s look at another example:

In this strategy we will look for a very specific setup:
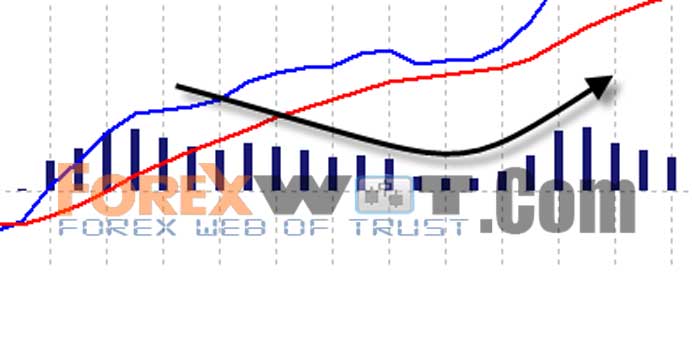
For a long trade, we want the histogram to:
- Be above zero level.
- Then we want it to start declining towards the zero level.
- After it nears the zero level, we want it to reverse and go up again.
This situation indicates that the market is on its way to a reliable uptrend, one that will allow us to join it.
An example of a long trade such as the one we’ve just described:

For a short trade, we want the histogram to:
- Be below zero level.
- Then we want it to start rising towards the zero level.
- After it nears the zero level we want it to reverse and go down again.
This situation indicates that the market is on its way to a reliable downtrend, one that will allow us to join it.
For example:

We want to join this downtrend.
Now, you are probably wondering: when exactly should we enter this trade?
In order for us to answer this question we should turn to our next indicator – the Slow Stochastic.
This indicator will help us with making a final confirmation of this trade and it will determine the exact point to enter it.
I’ve included the Stochastic with the Pips Carrier template, and this is what it looks like:

This indicator consists of two very important levels:
- Level 80 and level 20.
These two levels represent extreme zones. Level 80 reflects the overbought zone and level 20 represents the oversold zone.
I assume that when the market reaches these levels, it is about to change its direction. So, if the Stochastic reaches level 80, I would expect the market to turn down. If it touches level 20, I would expect it to go up.
After we’ve learnt about these two indicators, let’s see exactly how we should execute trades. I’m going to divide this explanation into the two possible scenarios:
- Entry for buy (long)
- Entry for sell (short)
1. First we need to recognize a turning point on the MACD histogram. This means that the blue histogram bars should be above the zero level, and then it should start declining. Finally it should reverse and go up again.
2. After we’ve made sure that conditions are met on the MACD histogram, we should turn to the Stochastic indicator and see its position: we need it to be on the oversold area (around level 20); we want the two lines to cross each other; and we want the lines to face up.
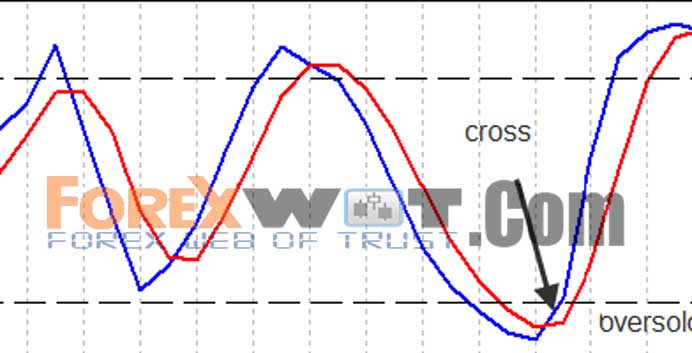
We want at least one of the averages to be below level 20.
3. Now is the moment we should determine our exact entry point. The moment we see the histogram rise again and the stochastic decrease to the oversold zone, we need to wait for the candlestick that created this condition to close.
As soon as the candlestick is closed, we should enter this trade.
Let’s analyze a long trade example:

In this example we can clearly see that the histogram is facing up again and that the Stochastic lines have crossed each other on the oversold level, on their way up.
Here is another screenshot of a long trade:

The histogram is facing up and the stochastic lines have crossed each other on the oversold zone, level 20.
There’s a very important point I would like to add. It refers to a situation where the histogram is above level 0 and declines below level 0.
If it happens (i.e., if it declines below level 0), it has to reverse and return immediately above this level on the next bar in order for this to be a valid trade setup.
For example:

Now that we understand how to enter a long trade, the next step is managing it correctly.
Let’s see how we should manage a long (buy) trade.
We place the stop loss 1 pip below our base candlestick, which is the candlestick where all the conditions have been met.
For Example:

Here I’ll close the trade in two parts: 80% of the trade will be closed initially, and then I’ll close the remaining 20%.
First Take Profit Target
My first take profit goal is to set a profit target of a 1:1 ratio between the stop loss and the take profit.
For example: If I risk 50 pips, my take profit target will be 50 pips. When the price reaches the first take profit target, I’ll close 80% of this trade.
Second Take Profit Target
After the first part of the trade has been closed, I will move the stop loss to the breakeven point (that is, I’ll change it to the trade’s opening price).
The second profit target is twice the stop loss.
For example: If I’ve risked 50 pips my second profit target is 100 pips.
This is a screen shot of target 2:

That’s it…
Our first take profit target is closed successfully in 80% of trades and the second profit target is closed with a profit in 45% of trades.
This strategy repeatedly generates impressive returns for me, and I’m sure that once you master it, you will see the difference in your bottom line as well.
On the following page we will analyze short trades.
How should we enter a short (sell) trade?
1. First we need to recognize a turning point on the MACD histogram. This means that the histogram should be below the zero level, and then it should start rising. Finally it should reverse and go down again.
For example:

2. After we’ve made sure that conditions are met on the MACD Histogram, we should turn to the Stochastic indicator and see its position: we need it to be on the overbought area (around level 80); we want the two lines to cross each other; and we want the lines to face down.

We want at least one of the averages to be above level 80.
3. Now is the moment we should determine our exact entry point. The moment we see the histogram fall again and the Stochastic reach the overbought area; we need to wait for the candlestick that created this condition to close.
As soon as the candlestick is closed, we should enter this short sell trade.
This is an example of a short sell trade:

Another Example of a short sell trade:

Please note: if a histogram is below level 0 and starts rising above this level, it has to reverse and return immediately below this level on the next bar in order for this to be a valid trade setup.

Now that we understand how to enter a long trade, the next step is managing it correctly.
We place the stop loss 1 pip above our base candlestick, which is the candlestick where all the conditions have been met.
We should add the spread to the stop loss in a short trade, so we place the stop loss 1 pip+ spread above the high of our base candlestick.

Here I’ll close the trade in two parts: 80% of the trade initially, and then the remaining 20%.
First Take Profit Target
My first take profit goal is to set a profit target of a 1:1 ratio between the stop loss and the take profit.
For example: If I risk 50 pips, my take profit target will be 50 pips. When the price reaches the first take profit target, I’ll close 80% of this trade.
Second Take Profit Target
After the first part of the trade has been closed, I will move the stop loss to breakeven point (that is, I’ll change it to the trade’s opening price).
The second profit target is twice the stop loss.
For example: If I’ve risked 50 pips, my second profit target is 100 pips.

That’s it my friend.
This strategy has proven to be very reliable and accurate. It is also easy to use—the ultimate way to enjoy and take advantage of market trends.
I wish you good luck with your trading and hope you’ve enjoyed reading this tutorial.
 Forex Profit Booster Trading Strategy – Most of The Time it Doesn’t Give False Signals
 2 MACD Effortless Forex & Stocks Swing Trading Strategy
 Forex Trading Short Course – How to Trade Forex with COG Trading Indicators and Strategy
 Forex and Crypto “MORNING TRADE” Trading Strategy for Advanced Traders
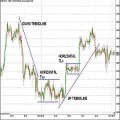 How to Do Accurate Forex Trend Line Analysis
 Best Forex & Stocks Trading Strategy with Dolly-Graphics System
 Forex Profit Matrix – Stay in Strong Trends with the Heiken Ashi Candlestick and Bollinger Band
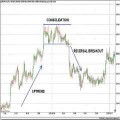 MACD RSI Trading – The Easiest Way To Measure Forex Reversal Breakouts
 Forex Color RSI Histo – The Best Trading System To Help You Find High Probability Trades
 Forex Made Easy – Cynthia’s Exponential MA Forex Trading System

Hi,
Please what is the best time frame and pairs to use this strategy??
i know you say any timeframe but which one is the best ?
Thanks
It doesn’t work, especially when price goes sideways, and you will lose a lot of money, second when price goes slow and oscillates giving false signals. This guy only selected perfect image that fit his approach but the reality is different. Markets slow or move sideways , and you will lose 80-100%
Thanks for sharing it’s very helpful for me.
Thanks for the article. I tried to use files with it but it has some problems. Did somebody succeed to run it properly? thanks
this is very good system
but
what is best time frame ?
m30?
This strategy is okay, I have been using it for a long time and I have been training my clients how to use it. It makes good returns. You can use it with any time frame of your choice, the rules apply to any time frame. Good luck trading.
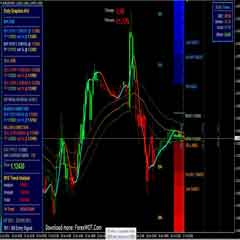
For those asking about the parameters, you can slightly see in his first screenshot that the MACD is set to to the typical 12,26,9. The Stochastic is set to 5,3,3
Looks like a solid use of two popular indicators. Thanks for the sharing.
Hello,
thank you for this amazing strategy! I have two questions: I first tried it on the 15m Chart, but the MACD seems a little bit too slow. Then i switched to the 5m. Chart and it seems more accurate. Do you think is a good idea to use the strategy consistently on the 5m. Chart?
Second question (situation):
For example i want to go long. The stochastic’s K and D periods crossed in the oversold area and are going up again, however the MACD is still pointing sideways. After a while all the conditions on the MACD Histogram are also met. In this case all the conditions are met, BUT not at the same time. (for example 15 min. later) Should i take the position ?
Thanks !!
Hence, forex news is essential in keeping traders updated.
so for your success always choose the best and proven forex trading system.
So the major advantage with Forex Wot System is that they provide you with buy
and sell signals and saves a lot of time for you which in general you lose a lot of time in analyzing the market conditions.
I would also like to know what are your settings for stochastics. That’s important bc I notice the decline of the candle sticks before the two averages touch. .thank you.
hello, i just wandering what the period setting for the stochastic you using ?
thanks
James
Hi
Just wondering what time frame you are using
Cheers
Colin
Hi Colin Arklay, Im using M15 time frame in london session only…