A Winning Forex Strategy – I’m sure that at this early stage after you read the instructions, the first thing you will do is run to your platform and start checking the credibility of my system.

That’s understandable, and I’m sure you’ll like what you see.The simplicity of this system is overwhelming along with its accessibility and the results it produces. The sRs is my secret and unique strategy which responsible for producing amazing profits. So, let’s begin…
Important Note: the rules I’ll detail here are incorporated in the sRs Alert, which is built in the sRs Template. Therefore, you don’t have to constantly watch the chart for these rules to occur. You just wait for an alert to sound, along with the following Alert window that will appear on the chart:

Later (in Rule #4) I’ll teach you what to do when this alert sounds.
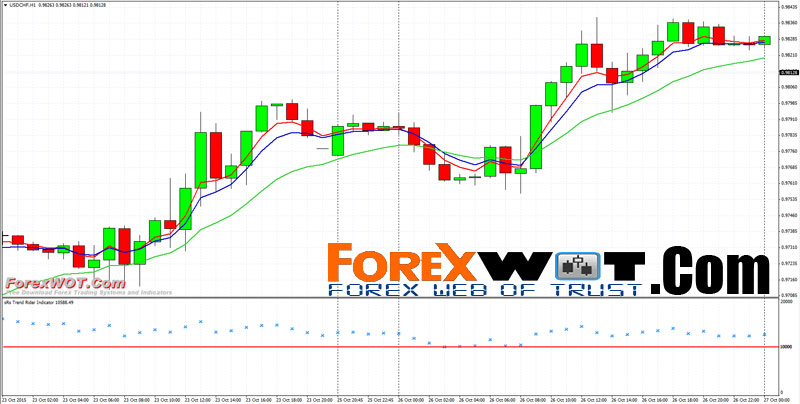
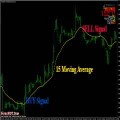
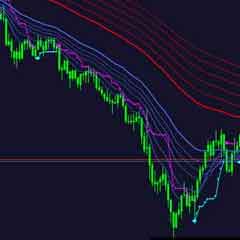
The template combines 3 moving averages, 4, 6 and 14 and the sRs Trend Rider Indicator.
As you can see, I differentiated between the moving averages with three colors, red, blue and green.
The combination of these 3 moving averages and the sRs Trend Rider Indicator will provide us with Current Market Trend.
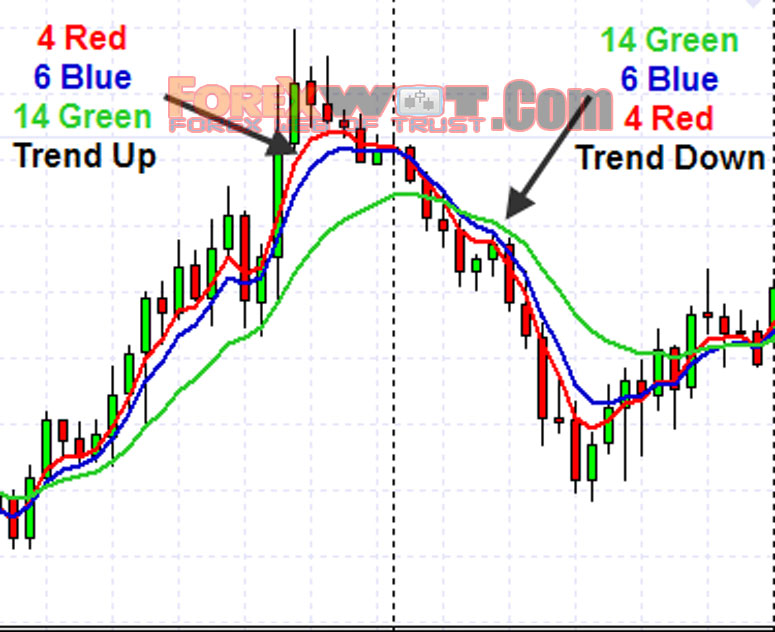
The working rules of the 3 moving averages are as follows:
4 above 6 and BOTH above 14 -> the market trend is UP (Bullish).

4 below 6 and BOTH below 14 -> The market trend is Down (Bear)

Let’s examine these rules together:
The sRs Trend Rider Indicator is the outcome of a thorough and long research into the Forex Market.
It combines several trend strength and price action measures, and based upon mathematical principles it tells us the market’s strength and direction with amazing accuracy.
We relate to the Level 10,000 as our Test point and the asterisks give us the market direction.

The automated Alert component of the sRs Template is designed to work with the indicator and sound an alert only if the indicator has passed its test level.
Therefore, you don’t have to constantly watch the indicator. Just wait for an alert to sound, along with the following Alert window that will appear on the chart:
Later (in Rule #4) I’ll teach you what to do when this alert sounds.
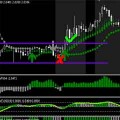
As you can see in the screenshot below, the template provides the 3 moving averages: 4, 6 and 14 respectively. These are used to give you the basic market direction.

Many people use moving averages in many ways. However I found that the way I’ll teach you here is the most effective and reliable way I can use them for my trading style.
At the bottom of the chart you’ll see the sRs Trend Rider Indicator that will give you the direction the market is moving IN RELATION to your test level 10,000 point.
In order to simplify your understanding of the sRs Trend Rider Strategy and its trading rules, I am going to divide my explanation into two parts.
In the first part, you are going to learn how to go long, or in other words, how to enter a Buy trade when the market goes up.
In the second part, you will learn how to go short, or how to sell the market when it goes down.
In both examples, I will show you why I enter the trade, and how I exit the trade profitably.
Important Note: rules #1, #2 and #3 are covered automatically by the sRs Alert component that’s part of the sRs Trend Rider template installed to your MetaTrader.
Therefore, you don’t have to constantly watch the chart for these rules to occur.
You just wait for an alert to sound, along with the following Alert window that will appear on the chart:
When the alert sounds, jump to Rule #4 which I call the “Eye Rule”. This is the only rule that can’t be automated.
Let’s look at the following graph to learn about my 4 rules:

Look at the sRs Trend Rider Indicator and see when the asterisk crosses the 10,000 line.

When the 10,000 line has been passed, then the first rule has been fulfilled.
For the sake of this example, it means that the market has moved toward an UP trend direction.
You can now move on to rule #2
Make sure that the 3 moving averages are set in the following order: 4 above 6 and both above 14.
As I explained earlier, the 3 moving averages are in fact a tool, which helps you identify and follow the trend. You want to be sure that the 3 moving averages are set accordingly.
Now that you understand rule #2, you now can move on to rule #3.
This rule is very simple. After you ensured the 3 moving averages are arranged in the required order (rule number 2), you switch to the next higher time frame, to ensure that the moving averages are arranged there in the right order as well.
By “next higher time frame” I mean, for example, if you’re working on the 5 minutes time frame (M5), you switch to the 15 minutes (M15).
By the way, the alert automatically checks this higher time frame for you, so it will only sound when the rule is being met in the 15 minutes chart, even if you don’t see the chart on screen.

So, continuing our example, you switch to the 15 minutes time frame and make sure that the 3 moving averages are set in the following order: 4 above 6 and both above 14.
If they’re not arranged in that order, it means you don’t have a high-probability setup, and therefore you may wish to wait for a better opportunity.
This is the “Human Eye” rule, which means it’s the only occasion when you have to use the strength of your eye’s observation to determine the trade’s entry point.
Don’t worry, after little practice you’ll easily master this simple rule.
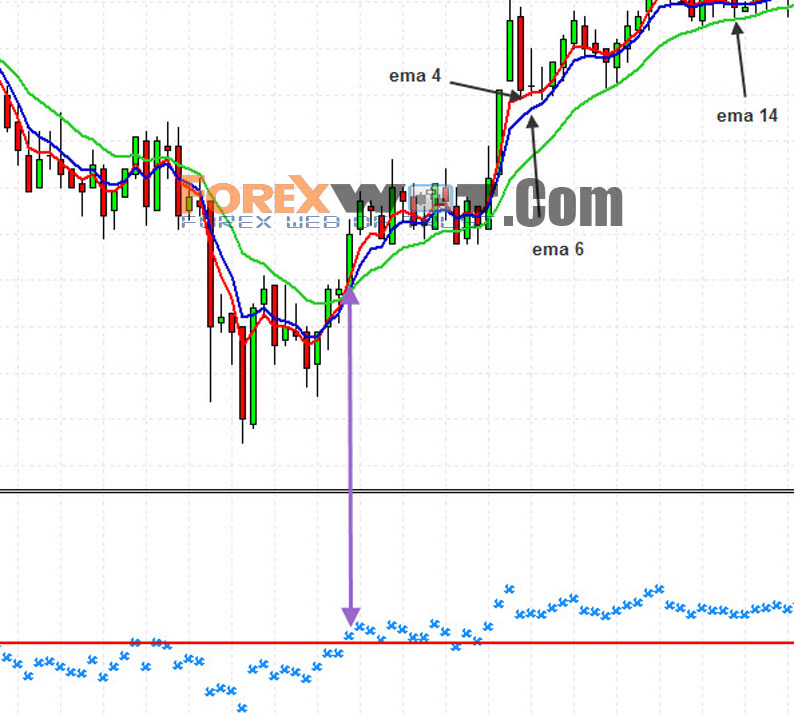
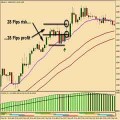
Rule #4 says that the trade should be entered at the break of the last high in the current up trend. I’ll now explain this in detail:
What you have to do is look at the current up trend. It’s usually just starting, but you can identify the highest price it has reached.

Notice the pink arrow head pointing upwards. This marks the spot when the market surpassed the previous high, which is the spot you should enter the trade.
Again, let’s examine the 4 rules in the opposite direction:

Note: as explained earlier, rules #1, #2 and #3 are automatically covered by the sRs Alert.
Look at the sRs Trend Rider Indicator and see when the asterisk crosses the 10,000 line.

When the 10,000 line has been crossed, than the first rule has been fulfilled.
For the sake of this example, it means that the market has moved toward a down trend direction.
You now can move on to rule #2
See when the 3 moving averages are set 14 above 6 and above 4.

When you understand rule #2, you can move on to rule #3.
This rule is very simple. After you ensured the 3 moving averages are arranged in the required order (rule #2), switch to the next higher time frame to ensure that the moving averages are arranged there in the right order as well.
For example, if you’re working on the 5 minutes time frame, you switch to the 15 minutes:

So, continuing our example, you switch to the 15 minutes time frame and make sure that the 3 moving averages are set in the following order: 14 above 6 and above 4.
If they’re not arranged in that order, it means you don’t have a high-probability setup, and therefore you may wish to wait for a better opportunity.
This is the “Human Eye” rule, which means it’s the only occasion when you have to use the strength of your eye’s observation to determine the trade’s entry point.
Don’t worry, after little practice you’ll easily master this simple rule.
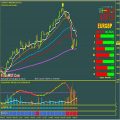
Rule #4 says that the trade should be entered at the break of the last low in the current down trend. I’ll now explain this in detail:
What you have to do is look at the current down trend. It’s usually just starting, but you can identify the lowest price it has reached.
What was the lowest price reached in this down trend?
Look at the example below. I had two red candles going down, then another small candle that reached a bit lower. You can see it in the screenshot marked by a black line (“last low”).
This was the lowest price reached at the time. When the market goes lower – we should enter the trade.

When trading on the 5 minutes (M5) time frame, if you find the required stop loss to be greater than 50 pips – don’t enter the trade!
This is too large a stop loss for a 5 minutes chart. The average stop should be between 25 – 40 pips.
Please note that the above are only my favorites, and it certainly doesn’t mean that the strategy don’t work with other currencies, time frames or trading hours!!
I have found the strategy to work well on all currency pairs.
Regarding trade times, if you pick the times when the markets are most active (the European and/or US sessions) than you’ll see more action on the chart, meaning you’ll reach your targets more quickly and easily, as with any other trading strategy.
Let’s do a quick summary of how to trade the sRs:
- The sRs Trend Rider Indicator shows the 10,000 level crossed.
- Moving Averages lined in an uptrend or downtrend direction.
- Alert is displayed.
- Check the “human eye” rule.
- Enter the trade and determine stop loss.
- Collect profits…
Just be sure to stick to the trading rules, don’t change them or give in to the temptation to close too early or to the fear of getting into a trade.
And don’t use high leverage! It always kills your account, no matter how good your strategy is. So be careful with your trade sizes.
Ok my friend; this is where you start the profitable part of your Forex journey.
 Highly Profitable Renko Street Trading System
 The Essence of Moving Averages: What Every Successful Forex Trader Should Know
 High Profitability Moving Average MACD Forex Strategies
 Trend Trading with Most Popular Moving Averages Technical Analysis
 Stocks and Currency Trading With GUPPY Multiple Moving Averages Trading System
 FREE DOWNLOAD 20+ Best Forex MACD-Moving Average Trading System
 Forex & Stocks Trading Strategy with EMA-MACD Trend Dominator System
 PROFX Simple Effective Forex Trading Strategy Using Heiken Ashi and MACD Crossover
 Forex and Crypto “MORNING TRADE” Trading Strategy for Advanced Traders
 Forex Made Easy – Cynthia’s Exponential MA Forex Trading System

alert dont work
Has anyone else tried this? I have been running it and what looks like setups the alert hasn’t gone off. I now have it on the lower time frames just to see if an alert for go off on any pair. Just curious to see if this has been working for people as far as the alert goes.
how to set the stop loss
Hi did you manage find out how?
rule 4 for buy entry using “human eye” what time frame should I refer if I currently working on the 5 minutes time frame.You said candle must break the last high but on what time frame?