Advanced Moving Average Forex Trading System. I’m not going to give a big introduction (you should already know a little about me from my website where you purchased this system).

All I‟ll say is that I hope you get everything out of Stupidly Simple Forex™ that you want. It really is a simple system and you should pick it up in no time at all – in fact, you really should be able to get going right away!
Anyway, with that in mind, I wish you luck and hope that you do as well with it as I have.
So I‟ll first give a quick run-down of the system and a few details before we get going.
Make trading easier for yourself and stick to the most liquid and popular pairs – they move more and have a lower spread – so your chances of profit are even higher.
Basically, trade anything that is made up of two of the following currency list: USD, EUR, GBP, JPY, CHF, NZD, AUD.
The system is mainly traded on the 5-minute, 15-minute and 30-minute timeframes.
But that‟s just a personal preference – the system works on all timeframes.
You can trade other timeframes if you like (I have done this) – the above timeframes are just a preference remember.
Stick to the most popular trading times – that‟s the London session (around 06:00GMT to around 16:00GMT) and the US session (around 13:00GMT to around 21:00GMT).
Of course you can trade outside these times – but again, keep the odds in your favour and stick to these – it will help your trading account!
Now that we have the moving averages under control and know what to look for in terms of when to trade and in which direction – it‟s time to focus on the other two indicators.
There are a number of ways to use the two indicators – but „V‟ uses them in what is quite probably the easiest way I‟ve ever seen.
I‟ll go through a buy entry…
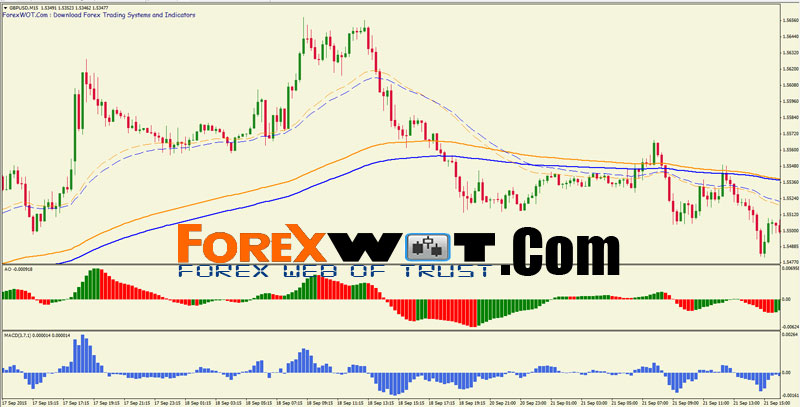
Step #1 – Make sure our moving averages are lined-up for a buy-trade:

Step #2 – We then wait for the „Awesome Oscillator‟ to fall below the 0.0-line:

Step #3 – The final „trigger‟ to the entry is when the MACD then closes above the 0.0-line:

…and that‟s us in a trade!
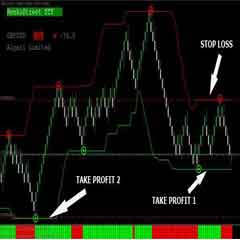
However, we do need to place a stoploss on our trade and take profit too – that is now Step #4 and Step #5.
Step #4 – Stoploss Placement
Our stoploss placement is fairly simple – it‟s not “technical” as with most stoplosses (which is when we “hide” it behind a significant technical level).
Instead we use a rough guide of:
- 10 to 20 pips on a 5-minute chart
- 15 to 30 pips on a 15-minute chart
- 20 to 40 pips on a 30-minute chart
It depends on which pair you‟re trading as to how large the stoploss is – you‟ll get an idea of the stoploss size after you‟ve made a few trades (I promise!).
This is a far more effective way (read: profitable!) than having to use a larger stoploss in the usual technical way.
Here‟s the stoploss used on our current trade:

Step #5 – Take Profit
Our take-profit is as simple as exiting when the MACD crosses back below the 0.0-line again:
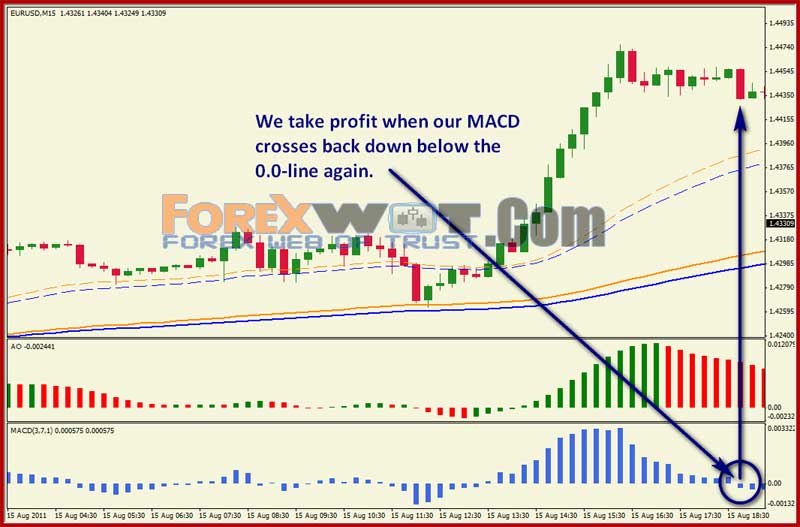
…and that‟s us out of the trade!
This was a nice, simple example.
Not every trade is going to be this perfect (obviously!) – but quite a few are!
So that‟s basically the system – but I‟m not going to leave you there.
We‟re now going to go through a number of trades and situations so that you really understand the system.
Over the remaining pages we‟ll go through more examples so that you fully understand the system.
The following trades are all similar (which is why this system is so great!) – but, there are small differences, so they should give you a better idea of what to expect when you start trading it yourself.
Sometimes it is obvious that some news, or an economic figure, has hit the market – and an entry signal is produced because of it.
Quite often this entry signal will not be good to take because news (contrary to popular belief) can be quite unpredictable.
In the example below, where the time was 13:30GMT when the entry occurred, the size of the candle shows us that it was a news-induced signal:

In summary to news:Watch the economic calendar so that you know the market may only be producing a trade entry because of some news or economic data.
The great thing about the moving averages we use is that we know well in advance whether we are going to get a trade – and so don‟t waste time sitting and staring at charts for no good reason!
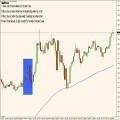
The chart below is the 5-minute GBP/USD – the left-most side of the chart below is around 06:00 GMT which is the London session open.
You can see that the moving averages are not in alignment – and that it will take a good few hours until they are. It‟s not until around 12:00 GMT that we can start looking for trade entries:

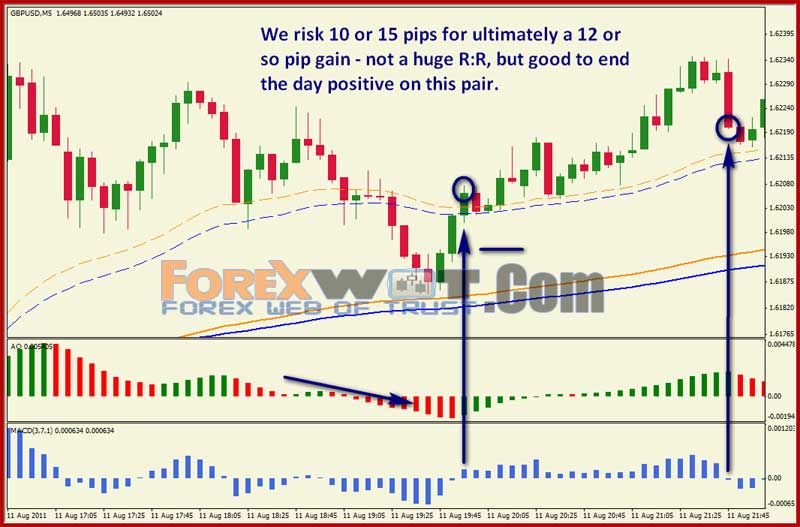
We do get an entry – which results in a small losing trade of around 3 or 5 pips:

The market then ranges for a while and the moving averages go out of alignment.
However, if we continue watching (and because it is the 5-minute chart) we can get yet another entry within the same day on the same pair:
In summary to perseverance:
If you have the time and opportunity – remember that all is never lost when intraday trading. Often the markets will totally change their dynamic before the end of the day and produce excellent opportunities if you stick to the system!
You‟re a trader, right ?…
That means you‟re inherently independently minded – sure, listen to what someone is teaching you (in other words, me!), but try your own ideas too!
We have the standard exit that we use – but occasionally I will break from this and go for larger runs.
One that I use often is the keep a trade (or at least part of it) running until the end of the trading day – which is usually around 21:00 GMT or 22:00 GMT.
We can end up with some big days doing this:

In summary to testing exits:
Question everything! Track your results from you trades – sometimes a minor “tweak” here or there (that no one else but YOU can do for your trading) can make a huge impact to your bottom-line and towards your consistent profits!
When you trade the higher timeframes (30-minute and perhaps even 60-minute) you can expect to get larger pip runs.
Trading the 5-minute and 15-minute charts you can pretty much expect to be out within the day.
Here‟s a trade on the AUD/USD hourly chart – you can see that our exit (if following our standard MACD crossing back through the 0.0-line method) is not until the next day:

Note that in this trade, had we exited at the end of the trading day, we would have ended up with a similar number of pips.
In summary to bigger timeframe, bigger pips:
Set your mental and psychological targets in-line with the timeframe you are trading. There is no point trading an hourly chart if you can‟t handle holding a position overnight!Further note: if you can‟t handle holding a position overnight – learn too!!
[sociallocker]
[/sociallocker]
 How Do I Become a Good and Prifitable Forex Trader
 Foreign Exchange Currency Trading & Investment Strategy – Forex Z 20 System for Successful and Highly Profitable Forex Trader
 High Accuracy Volty Channel Stop RSI Trading Strategy and How to Win Consistently in Forex Trading
 Forex and Crypto “MORNING TRADE” Trading Strategy for Advanced Traders
 Best Forex & Stocks Trading Strategy with Dolly-Graphics System
 Forex Bill Williams Market Facilitation Index (BW MFI) Multi Trend Trading System and Strategy
 High Probability Trading: The 10 Pips Forex Trading Strategy
 Sure Forex Breakout System Absolutely Amazing and Easy Forex Strategy
 EASY Forex H1 IntraDay Trading System With Bill Williams Alligator Multi Trend Signal
 Highly Profitable Renko Street Trading System
