Heikin-Ashi chart looks like the candlestick chart, but the method of calculation and plotting of the candles on the Heikin-Ashi chart is different from the candlestick chart. The Heikin Ashi candlestick chart looks like the real candlestick chart but there’s a difference:

- In a candlestick chart, each candlestick has four different prices which are: open, high, low & close. Each candlestick that is formed after has not relationship with the one the formed previously.
- But with heikin ashi candlestick, each candlestick is calculated using some information from the previous candlestick:
If you wan’t to know more here is a brief detail of how the heikin ashi candlesticks calculated and plotted:
- Open price = average of the open and close of the previous candlestick
- High price = is chosen from the one of the high, open and close price of which has the highest value.
- Low price = is chosen from the one of the high, open and close price which has the lowest value
- Close price = is the average of the open, close, high and low prices.
Which means each candlestick that is formed on the heikin ashi chart is related to the previous one before it-therefore it causes the heikin ashi to delay-just like a moving average indicator.
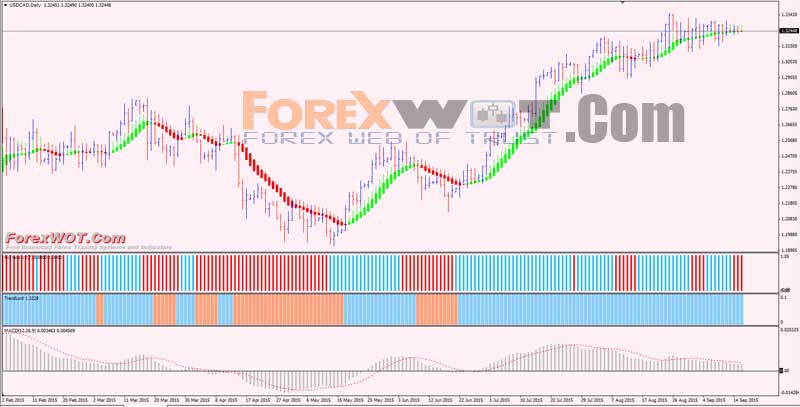
Heikin Ashi candlestick charts are used in the same manner as a normal candlesticks.
However there is an additional feature of heikin ashi that makes them different from standard candlestick charts and it is this:
the colour of the heikin ashi candlestick is supposed to indicate the overall trend direction of the market
which means it ignores the intermediate trend direction which is happening. In other words, it avoids the noise.
In summary: heikin ashi candlestick chart patterns allow you to stay with the overall trend by allowing your to avoid the noise or the minor fluctuations of price that is prevalent in a standard candlestick chart!
That’s all there is for you to know about Heikin Ashi Candlestick Charts
 Top 10 Super Effective High Profits Forex Heiken Ashi Trading System and Strategy
 2 MACD Effortless Forex & Stocks Swing Trading Strategy
 FREE DOWNLOAD 20+ Best Forex MACD-Moving Average Trading System
 How to succeed at Forex Trading with Heiken Ashi Laguerre Trading System and Strategy (HeikenAshi)
 Forex Trading Tips – Best 5+ Trading Systems You Need to Know to be a Successful Trader
 Top 5 Trading Systems & The Best Way to do Forex Trading
 Forex Heiken Ashi Moving Average Trading System with Multi MACD and QQE Period Indicator (MACD)
 Super Effective Follow Trend Trading with Heiken Ashi Profit Supreme
 Trading the Trend Momentum with Heiken Ashi Candlesticks and BBands Stop Analysis
 Advanced Moving Average Forex Trading System and Strategy
