The market moves in up and down waves that form “swings”. The pattern made by these swings is what is used to define an uptrend or a downtrend. The highs and lows of the waves are used to define “support’ and “resistance” levels. A trader or technician does not care about the fundamental reasons that are behind an up wave or down wave. The main concern is which waves offer the greatest trading opportunities.

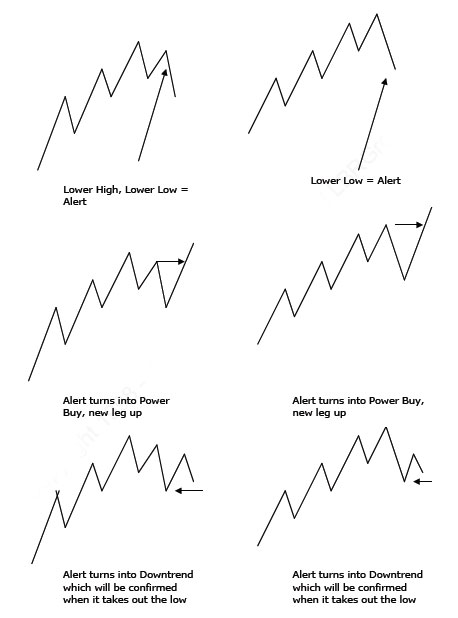
An up-trend is defined by a pattern of higher highs and higher lows. When a market reverses the trend from up to down, it must first make a lower high and a lower low, or, a lower low and a lower high, and THEN turn down from there (meaning take out the last swing low for confirmation).
Any method used to define the trend will have spots of ambiguity as well as signals that fail to generate follow-through. Any method used to define a trend, will also be confirming a trend reversal well after the high or low of the prior trend has been made.
There are 5 types of trading signals generated by the patterns formed by the waves.
- Buying a down wave in an established up trend or selling an up wave in an established down trend. This is a simple retracement entry in the direction of the prevailing trend.
- Buying a corrective A-B-C down wave in an up trend (Power Buy) or selling a corrective X-Y-Z up wave in an overall downtrend (Power Sell). This is a complex retracement formation in the direction of an established trend as opposed to the simple reaction noted in point 1. It should appear as a simple retracement on a higher time frame.
- Entering at the point of a trend reversal from down to up or up to down. Note: A trend reversal can be seen as occurring when a power buy or power sell has failed to lead to a new high or new low. When the market makes a new lows after a failed power buy – this is the point of confirmation of a trend reversal as well as a breakout point. The “sideways line” that forms when a market is going through the trend reversal process is what gives the market power for a larger move in the opposite direction.
- Shorting a failure test at the end of an up trend or buying a failure test at the end of a downtrend. A failure test is a lower high or higher low at the end of a swing. This is a more aggressive type of trade since it is against the prevailing trend and thus a stop right beyond the most immediate swing must be kept in place. isk but also, but lower.
- Entering on a breakout from a formation in which the waves have had considerable overlap as well as a shortening in either amplitude or duration. The corresponding chart formation often appears as a long rectangle, triangle or wedge. A period where the waves overlap each other for an extended period forms a “sideways line” and can also be called a coil. Breakouts are especially powerful when converging trendlines can be drawn around the chart formation.
Market technicians have used an assortment of ways to define a “wave”. Percentage up or down from the most recent swing high or low, a price swing low or high that is bordered on both sides by two bars with lower highs or higher lows, range functions, and simple visual inspection are just a few of the methods that can be used.
William Dunnigan originally explored percent swings versus range function back in the 1930’s. Arthur Merrill expanded on this in his Filtered Waves book published in 1977. We prefer Average True Range functions similar to those published by Welles Wilder in his 1978 book, New Technical Concepts. Keep in mind that there are no “right” or “wrong” parameters when quantifying Waves. There are both pros and cons to varying the “sensitivity” levels for what turns a wave up or down.
The following are the parameters that are used in LBRGroup’s back-testing and charting software applications.
- Lowest low of last 14 bars + 2.5 ATR (Average True Range over 15 bar look back period) = Up-wave.
- Highest high of last 14 bars – 2.5 ATR – point at which down wave begins.
A trader wishing to modify parameters can start by varying the ATR function or use the lowest close instead of the lowest low as the point by wish to measure a reversing swing.
Defining the Trend – summary:
All information used to define the waves that form reversal patterns comes from the raw price data.
- Definition of an up trend: The market must make BOTH a higher high and a higher low, and then turn up from there. The up trend is confirmed when the last swing high is then taken out.
- Definition of a downtrend: The market must make BOTH a lower low and lower high and then turn back down. The downtrend is confirmed when the last swing low is then taken out.
This classic method of defining a trend from the pattern of the swing highs and swing lows has occasional whipsaws as well as lack of follow-through, but it is the truest means and works just as well if not better, than complicated formulas or moving averages.
There can be a downtrend on the short-term time frame and an up-trend on a higher time frame at the same time.
There will be periods where the true trend may appear to be ambiguous.
Trend analysis on multiple time frames is used to improve risk/reward ratios as well as determining leverage. If there is an established trend on multiple time frames, more leverage should be used. If two time frames are in opposing trends, the market is in a consolidation period and lower leverage should be used.
Concentrate on the particular time frame you choose to trade on, but look at higher time frames to determine if a small or large target should be played for as well. The number one determining factor for which time frame to trade on should be the amount a trader can afford to risk.
Classic Chart Formations as defined by Waves
All chart formations are comprised of variations of the patterns in the waves on some time frame. They represent areas where buyers and sellers come into temporary balance and the moves out of these balance periods can occur in the direction of the trend, or, in the opposite direction indicating a trend reversal. It is still the patterns in the waves that hold the forecasting value, though.
The danger in looking at chart formations without respect for analysis of the waves is that a trader will often “see” what he wants to see. The other trap traders fall into when looking at chart formations is looking for reversal or continuation patterns without analysis of the wave structure on a higher time frame, thus failing to pu a formation into a “context”.
Let’s examine how the waves form classic well-known chart formations, keeping in mind that all chart formations must be considered in relation to the structure on the higher time frames, or, the longer-term trend.
Bar Chart Patterns – Breakout Formations
The bigger the chart formation, the more potential for a trend move. The larger the chart formation, the higher the odds that it will prove to be a reversal formation as opposed to a continuation pattern. Head and shoulders chart formations are one of the most reliable formations when viewed in context of the pattern in the waves.
Triangles, rectangles, wedges, and saucers or rounding bottoms or tops are some other more common classic chart formations. The most important considerations for chart formations is that the waves fluctuate on both sides of a central price level for an extended period, and trendlines can be drawn around the price action.
Continuation Patterns – Bull and Bear Flags
Bull or Bear flags occur when there is a well-defined trend. It occurs in the direction of the trend and is preceded by “impulse”, which is also what forms the “pole” for the flag.
When the market is in a trading range, there can often be the appearance of a bull or bear flag, but more often than not the pattern will fail to have any follow-through. It is also a trap to look for a bull or bear flags after a buy or sell climax. Trends end in a climax and too many times a trader will look to “fade” the first reaction after a climax. The best flag formations have significant “price bar overlap“.
Complex flag formations appear as a three part A-B-C retracements in a trend. These are often a bit longer in duration than a traditional flag or pennant pattern. According to Elliott Wave theory, about every third retracement pattern will be “complex” instead of a simple bull or bear flag.
V-Spike Climax Reversal Patterns
A “V” spike reversal is a climax pattern in which a push to new highs or lows leads to a sharp and dramatic price rejection.
Though this pattern does not occur very frequently, it is one of the more powerful chart formations, as it tends to lead to a sharp swing in the opposite direction. There must be both range expansion and an increase in volume followed by a sharp reaction in the opposite direction that forms what is commonly called a “tail”. Noe: A well defined bull or bear flag will not leave a “tail”.
V-Spike reversals do not happen very often, but a trader must recognize the sharp reversal in momentum to the opposite direction and be ready to switch gears.
More Reading Material
There is much to be said for studying classic chart patterns, and there are plenty of books written on them. The best one of these is Schabacker’s original book called Technical Analysis and Stock Market Profits. The main points from this section to remember are:
- Reversal patterns can take a long time to form.
- The longer the chart formation, the greater the odds that it will be a reversal pattern.
- The best short term trading patterns are the brief “continuation” patterns such as bull and bear flags.
 How Do I Become a Good and Prifitable Forex Trader
 Learn Forex Online – WOLFE WAVE Trend Advanced Forex Trading System
 Foreign Exchange Currency Trading & Investment Strategy – Forex Z 20 System for Successful and Highly Profitable Forex Trader
 High Accuracy Volty Channel Stop RSI Trading Strategy and How to Win Consistently in Forex Trading
 Best Forex & Stocks Trading Strategy with Dolly-Graphics System
 Forex Bill Williams Market Facilitation Index (BW MFI) Multi Trend Trading System and Strategy
 The Easiest Way To Trade 3 Most Powerful Chart Pattern with CCI Trend Bars and Gann SSL Indicator
 High Probability Trading: The 10 Pips Forex Trading Strategy
 Sure Forex Breakout System Absolutely Amazing and Easy Forex Strategy
 Forex and Crypto “MORNING TRADE” Trading Strategy for Advanced Traders
