Best Multiple Time Frame Trading Analysis – Forex H4-Weekly Multiple Time Frame System Analysis to Find Better Entry and Exit Points. This is where multiple time frame analysis comes into play.

This is where we’ll teach you how to not only lock in on your preferred trading time frame but zoom in and out of charts so that you can knock a winner out of the park.
Multiple time frame analysis is simply the process of looking at the same pair and the same price but on different time frames.
Remember, a pair exists on several time frames – the weekly, the daily, the hourly, the 15-minute, heck, even the 1-minute!
This means that different forex traders can have their different opinions on how a pair is trading and both can be completely correct.
Don’t try to get your face closer to the market, but push yourself further away.
You have to remember, a trend on a longer time frame has had more time to develop, which means that it will take a bigger market move for the pair to change course.
Also, SUPPORT and RESISTANCE levels are more significant on longer time frames.
Start off by selecting your preferred time frame and then go up to the next higher time frame.
The best use of multiple time frame analysis is – you can zoom in to help you find better ENTRY and EXIT points.
By adding the dimension of time to your analysis, you can obtain an edge over the other tunnel vision traders who trade off on the only one-time frame.
Did you get all of that? Well, if you didn’t, no worries – we’re gonna go through an example now to help make things a little clearer.
Many traders think that the 15-minute charts are too fast while the Daily take too long.
So,
…the best time frame to trade is H4.
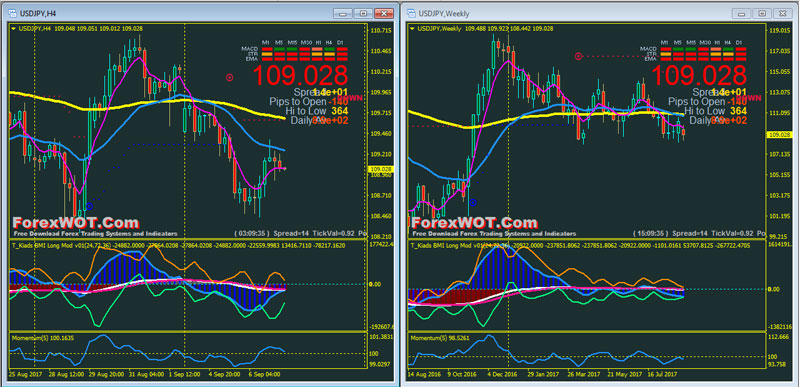
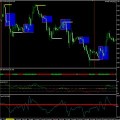
The first thing that we do is move up to check out the WEEKLY chart of our currency pairs. This will help us determine the OVERALL TREND.
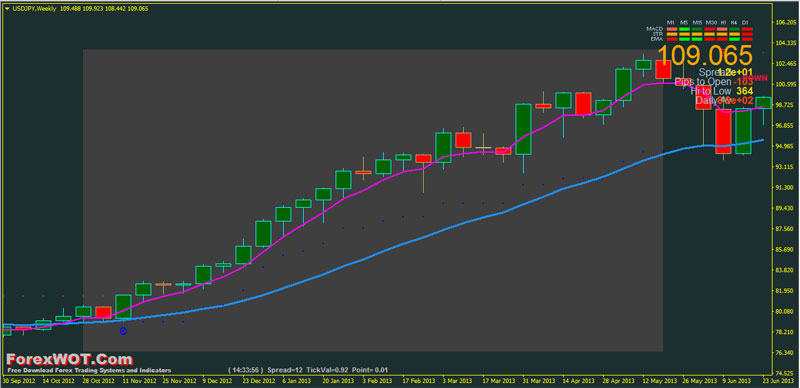
Above, we see that the USDJPY pair is clearly in an uptrend (on the Weekly time frame chart). the dominant trend is established.
This signals to us that we should ONLY be looking for BUY signals.
After all, the trend is your friend, right?
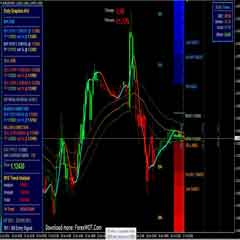
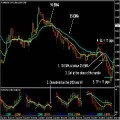
Now, zooms back to your preferred time frame, the 4-HOUR, to help you spot an ENTRY point.
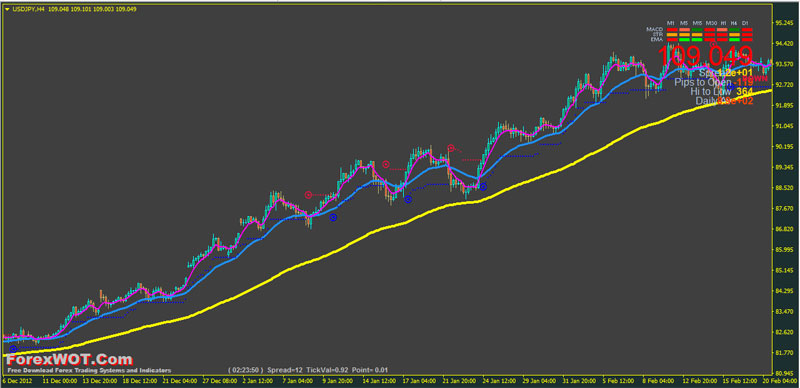
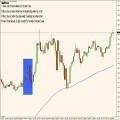
As you can see we have drawn a minor trend on the H4 time frame (Blue and Magenta Moving Average line) and we will enter the market based on the trading rules.
There is obviously a limit to how many time frames you can study. You don’t want a screen full of charts telling you different things.
Use at least two (H4 and Weekly time frames), but not more than three-time frames because adding more will just confuse you and you’ll suffer from analysis paralysis, then proceed to go crazy.
In this trading system, you only trade when H4 and WEEKLY time frames MOVING IN THE SAME DIRECTION.

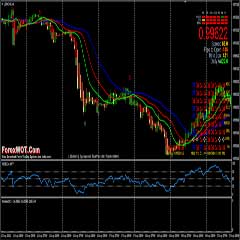
- H4 and WEEKLY time frames MOVING IN THE SAME UpTrend DIRECTION
- Blue circle ABC Trending indicator appear below the price
- EMA 5 > EMA 13 > EMA 55
- T KIads BMI indicator bullish
- Momentum line upward above 100 level
- Signal Trend Green color bars
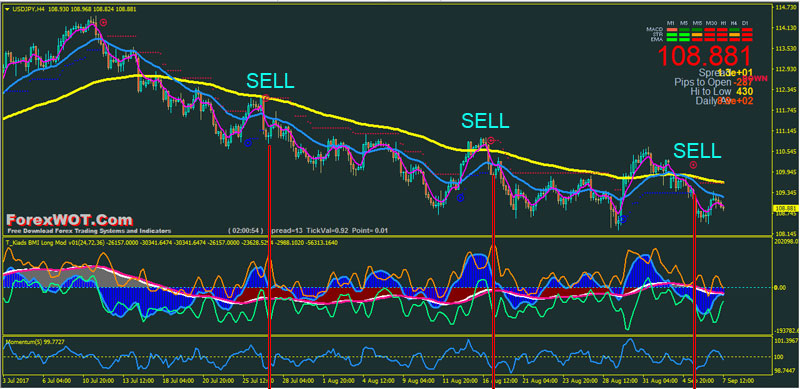
- H4 and WEEKLY time frames MOVING IN THE SAME DownTrend DIRECTION
- Red circle ABC Trending indicator appears above the price
- EMA 5 < EMA 13 < EMA 55
- T KIads BMI indicator bearish
- Momentum line downward below 100 level
- Signal Trend Red color bars
To implement Multiple Time Frame Analysis, after we establish the dominant trend (weekly time frame trend), we have to check a couple of lower time frame charts and not enter the trade until they are in agreement with the longer time frame chart that we used to establish the trend. In this trading system we use H4 time frame but if you want, you allowed open H1 time frame too.
Once they are all in agreement, we enter the trade. It is like aligning the tumblers in a lock. Once that is accomplished, the lock will open freely.The
It is like aligning the tumblers in a lock. Once that is accomplished, the lock will open freely.
 How Do I Become a Good and Prifitable Forex Trader
 Foreign Exchange Currency Trading & Investment Strategy – Forex Z 20 System for Successful and Highly Profitable Forex Trader
 High Accuracy Volty Channel Stop RSI Trading Strategy and How to Win Consistently in Forex Trading
 Best Forex & Stocks Trading Strategy with Dolly-Graphics System
 Forex Bill Williams Market Facilitation Index (BW MFI) Multi Trend Trading System and Strategy
 High Probability Trading: The 10 Pips Forex Trading Strategy
 Sure Forex Breakout System Absolutely Amazing and Easy Forex Strategy
 Forex and Crypto “MORNING TRADE” Trading Strategy for Advanced Traders
 EASY Forex H1 IntraDay Trading System With Bill Williams Alligator Multi Trend Signal
 Simple Powerful and Effective Forex Price Action Trading Strategy Using Moving Average
