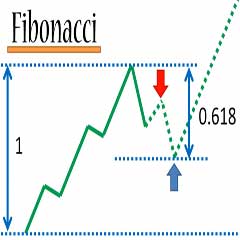
How to use Fibonacci Retracement in forex market – The first thing you should know about the Fibonacci tool is that it works best when the forex market is trending.

The idea is to go long (or BUY) on a retracement at a Fibonacci support level when the market is trending up and to go short (or SELL) on a retracement at a Fibonacci resistance level when the market is trending down.
- Traders use the Fibonacci retracement levels as potential SUPPORT and RESISTANCE areas.
Since so many traders watch these same levels and place BUY and SELL orders on them to enter trades or place stops, the support and resistance levels tend to become a self-fulfilling prophecy.
- Traders use the Fibonacci extension levels as PROFIT TAKING LEVELS.
Again, since so many traders are watching these levels to place BUY and SELL orders to take profits, this tool tends to work more often than not due to self-fulfilling expectations.
In order to apply Fibonacci levels to your charts, you’ll need to identify Swing High and Swing Low points.
- A Swing High is a candlestick with at least two lower highs on both the left and right of itself.
- A Swing Low is a candlestick with at least two higher lows on both the left and right of itself.
In order to find these Fibonacci retracement levels, you have to find the recent significant Swing Highs and Swings Lows.
- Then, for DOWNTRENDS, click on the Swing High and drag the cursor to the most recent Swing Low.
- For UPTRENDS, do the opposite. Click on the Swing Low and drag the cursor to the most recent Swing High.
Take a look at the image below.
This is a weekly chart of USD/CAD.
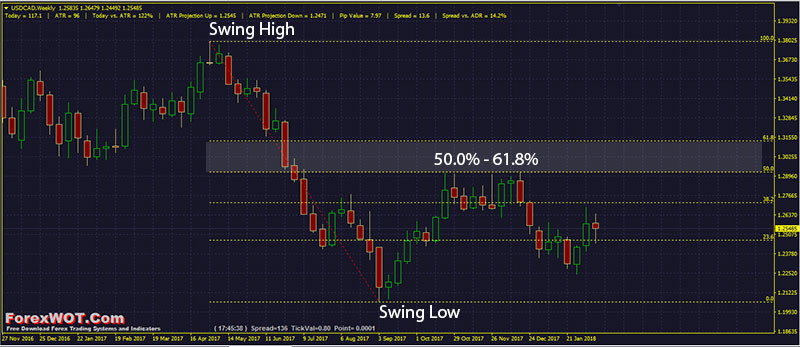
As you can see, we found our Swing High at 1.3790 on April 30 and our Swing Low at 1.2050 a few weeks later on September 3.
The retracement levels are 1.24667 (23.6%), 1.27198 (38.2%), 1.29263 (50.0%), and 1.31295 (61.8%).
The expectation for a downtrend is that if price retraces from this low, it could possibly encounter resistance at one of the Fibonacci levels because traders who want to play the downtrend at better prices may be ready with SELL orders there.
This is a daily chart of AUD/USD.
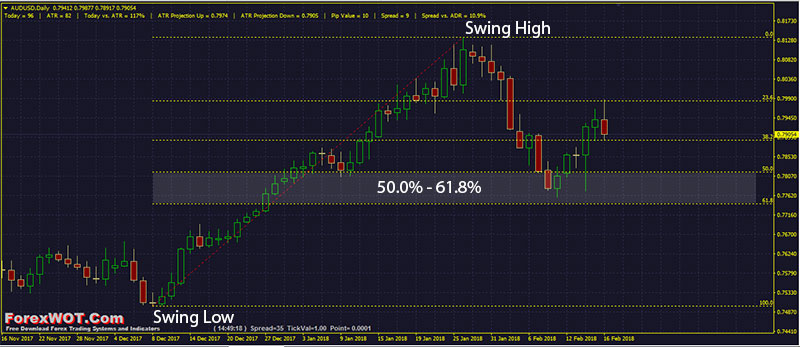
Here we plotted the Fibonacci retracement levels by clicking on the Swing Low at 0.75004 on December 08 and dragging the cursor to the Swing High at .81340 on January 26.
As you can see from the chart, the Fibonacci retracement levels were 0.79842 (23.6%), 0.78914 (38.2%), 0.78165 (50.0%), and 0.77416 (61.8%).
Now, the expectation is that if AUD/USD retraces from the recent high, it will find support at one of those Fibonacci retracement levels because traders will be placing BUY orders at these levels as price pulls back.
In these two examples, we see that price found some temporary forex support or resistance at Fibonacci retracement levels.
Because of all the people who use the Fibonacci tool, those levels become self-fulfilling support and resistance levels.
By adding Fibonacci to your trading, not only can you locate future targets for stops and exits but you can also find triggers to improve your forex trading results in as little as two steps.
However, every trader wants to find high probability set-ups EASILY.
And this Auto Fibonacci Retracement Trading System is the best solution for the new Fibonacci users.
Because of they able to use the indicator automatically and don’t need to identify Swing High and Swing Low points.
- Best Time Frames: H1, H4, Daily, Weekly
- Most Recommended Currency Pairs: GBPUSD, EURUSD, USDJPY, and all Major Pairs
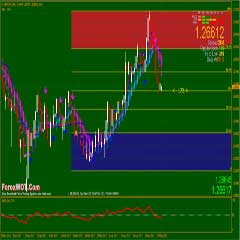
- Auto FiboTrade Zone
- ATR Projections
- Signal Trend
- Accelerator Oscillator
- Stochastic Oscillator
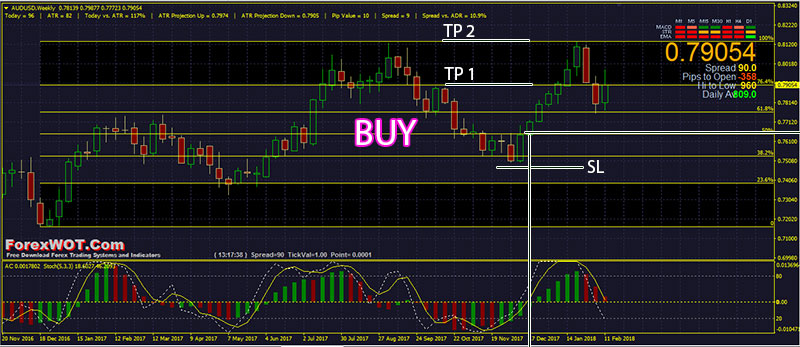
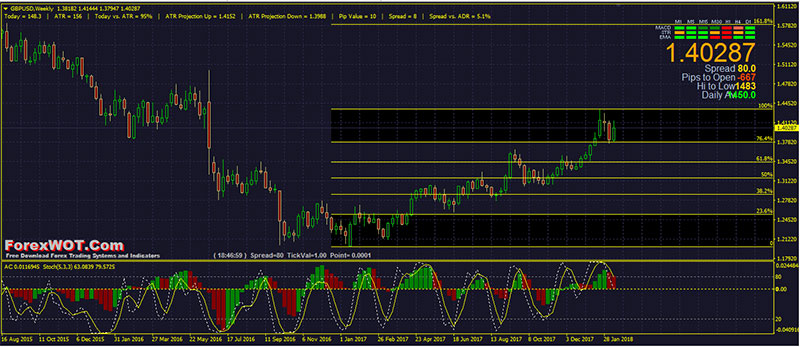
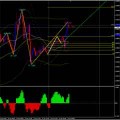
- Trend is UP (UPTREND)
- The expectation is that if AUD/USD retraces from the recent high to find support at one of those Fibonacci retracement levels.
- We will be placing BUY orders at the levels as price pulls back (Accelerator Oscillator green color bar and Stochastic Oscillator upward)
- Signal Trend green color bars
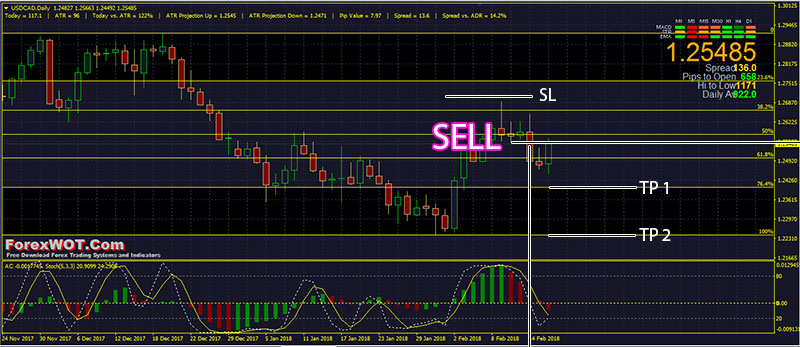
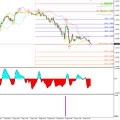
- Trend is DOWN (DOWNTREND)
- The expectation is that if USD/CAD retraces from the recent low to find resistance at one of those Fibonacci retracement levels.
- We will be placing SELL orders at the levels as price pulls back (Accelerator Oscillator red color bar and Stochastic Oscillator downward)
- Signal Trend red color bars
One thing you should take note of is that price won’t always bounce from these Fibonacci Retracement Levels.
Oscillator indicators are good tools to combine with Fibonacci indicator.
 Advanced Moving Average Forex Trading Tutorial – How To Become A Successful Forex Trader With Moving Average Indicator
 Improve Your Forex Trading Strategy With 3 Best Fibonacci Trading Systems
 How Do I Become a Good and Prifitable Forex Trader
 Forex Magic Breakout EMA CCI Trading – Maximize Your Profits and Achieve Exponential Earnings
 Forex Auto Fibo Trade Zone Trading Strategy (Fibonacci 50% Retracement System)
 High Accuracy Volty Channel Stop RSI Trading Strategy and How to Win Consistently in Forex Trading
 Forex Fibonacci Retracement Price Action Systematic Trend Following Trading Strategy (FIBO)
 Forex DayBreak Fibonacci Retracement Indicator and Trading System
 Forex Bill Williams Market Facilitation Index (BW MFI) Multi Trend Trading System and Strategy
 Foreign Exchange Trading : Online Forex Master Level Trading System and Strategy
