High Accurcy Forex SUPER MOMENTUM Trading – This is your best momentum indicators forex technical analysis & trading system. How to Trade with the Momentum Indicator, What the momentum indicator is and how to use it.

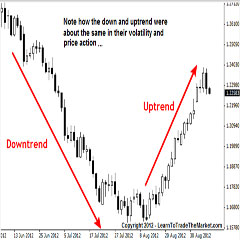
One of the key concepts in technical analysis is THE IDEA OF TREND.
Many strategies rely on identifying whether the market is in a trend or not — and from there, working out if a trend is beginning or coming to an end.
Knowing whether a trend is starting up or just about to break down is an extremely useful piece of information to have at your trading process.
Part of knowing whether a trend will continue comes down to judging just how much gusto lies behind the move. This strength behind the trend is often referred to as MOMENTUM, and there are a number of indicators that attempt to measure it.
The Momentum indicator is a speed of movement indicator designed to identify the speed (or strength) of market price movement.
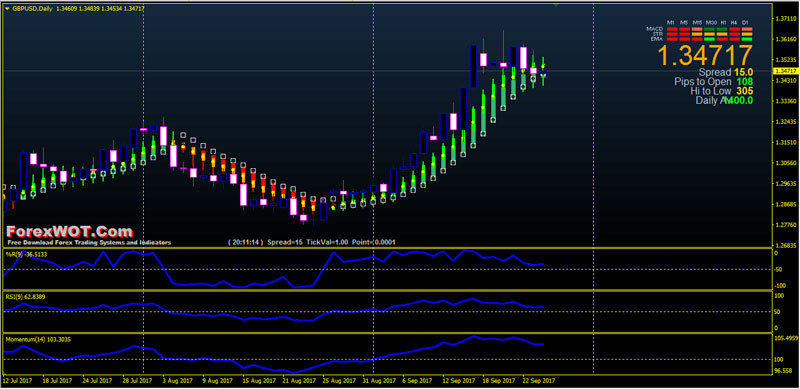
Some of the best and the better-known momentum indicators are Relative Strength Index (RSI), Williams’ Percent Range (%R), and Momentum.
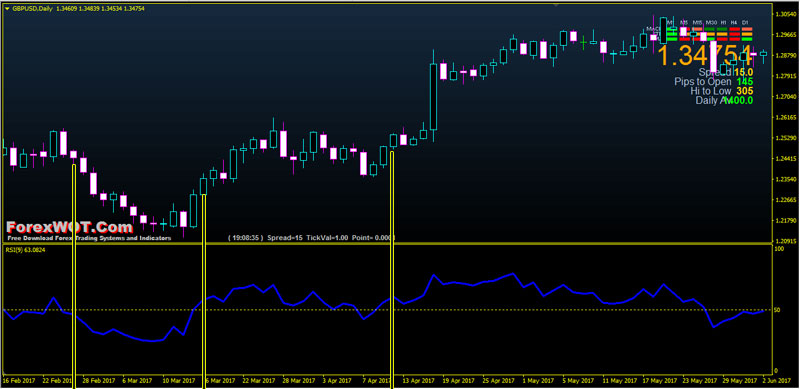
The Relative Strength Index (RSI), developed by J. Welles Wilder, is a momentum oscillator that measures the speed and change of price movements.
The RSI oscillates between zero and 100. Traditionally the RSI is considered overbought when above 70 and oversold when below 30. Signals can be generated by looking for divergences and failure swings. RSI can also be used to identify the general trend.
But in this trading system, I use the 50 level that sits between the 30 and 70 levels.
RSI 50 level can be used as a strong tool to confirm the different kinds of trade setups from any trading system.
Whether you use the candlestick patterns, support/resistance breakout, or any other trading system, you can consult the RSI 50 level to confirm your trade setups.
RSI is a very intelligent and smart indicator, and it gives a lot of useful information about the markets. Let me show you the examples below.
The “Williams Percent Range”, or “%R”, indicator is a popular “MOMENTUM” technical indicator.
As with any technical indicator, a Williams Percent Range chart will never be 100% correct. False signals can occur, but the positive signals are consistent enough to give a forex trader an “edge”.
Skill in interpreting and understanding Williams Percent Range signals must be developed over time, and complementing the %R tool with another indicator is always recommended for further confirmation of potential trend changes.
Like RSI, in this trading system, we use the -50 level as a signal trigger.
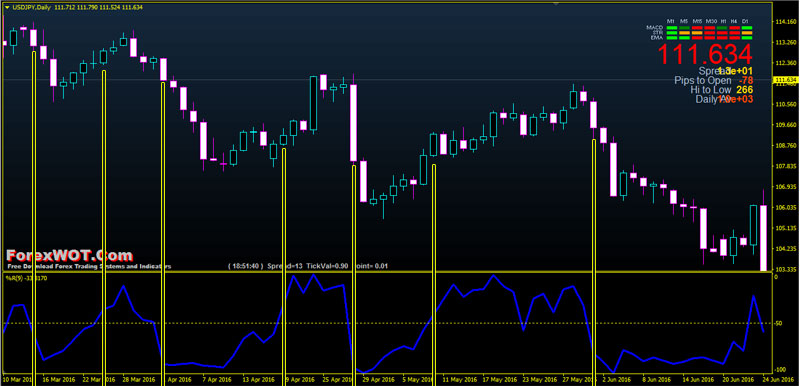
The Williams’ Percent Range is viewed as a “leading” indicator, in that its signals foretell that a change in trend is imminent.
Forex traders favor the Williams Percent Range indicator because of its ability to foretell reversals one to two periods ahead of time.
The momentum indicator comes as one of the standard indicators that are available as part of the default version of MT4.
The calculation behind the momentum indicator is fairly straightforward.
The indicator works by making a comparison between a certain price and the price a set number of periods before that. The first step is to choose a value for N, the number of periods that will be used for the comparison.
The momentum MT4 default value for N is 14, but you can set it to whatever value you see fit to use (in this trading system we use 9).
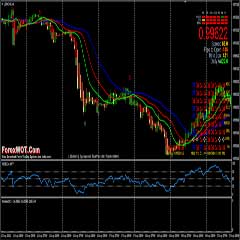
This is how it looks:
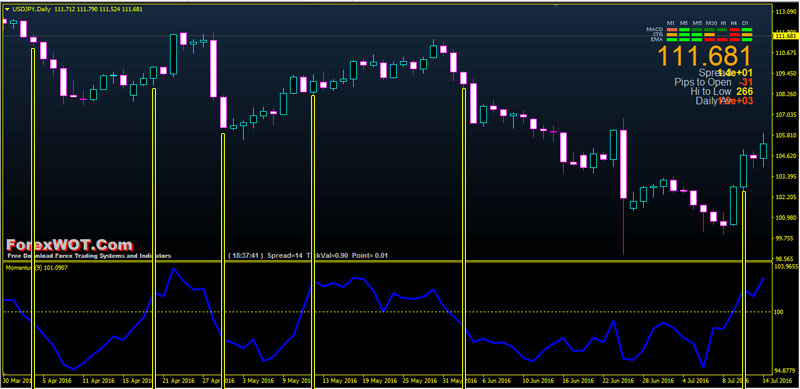
You can see that over the course of our chart, the momentum indicator varies from about 103.96 down to 94.87.
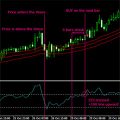
The simplest signal is to take any cross across the centreline as a signal, buying when the value rises from beneath 100 to above and selling when it drops below 100 from above.
The further above 100, the faster the price is moving upwards. The further below 100, the faster the price is moving down.
You can use the momentum indicator to provide trading signals directly, but it is more commonly used as a confirmation tool.
This ForexWOT Momentum Technical Trading is a forex strategy trend following based on the best top 3 Momentum indicators and Heiken Ashi.
- Best Time Frames: H1,H4, and Daily
- Most Recommended Currency Pairs: GBPJPY, USDJPY, and EURUSD
- Fade Background
- Power price action (heiken ashi modified)
- Power price action 2 (heiken aschi modified)
- Pwer Rail Train
- SignalTrend
- Momentum
- RSI
- Williams’ Percent Range
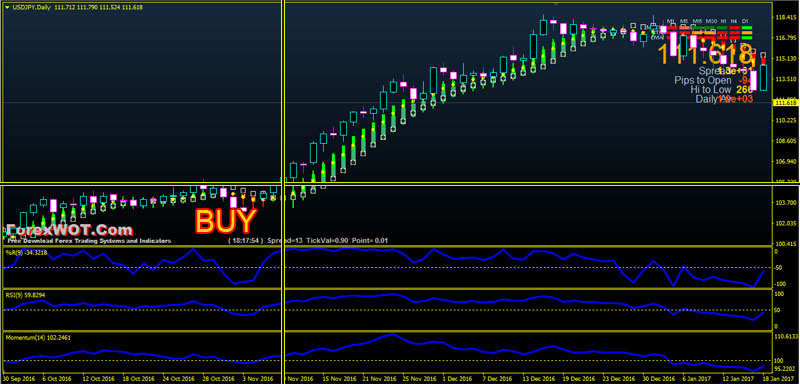
- Power price action (Green color)
- Power price action 2 (Green color)
- RSI line upward above 50 level
- Williams’Percent Range line upward above -50 level
- Momentum MT4 line upward above 100 level
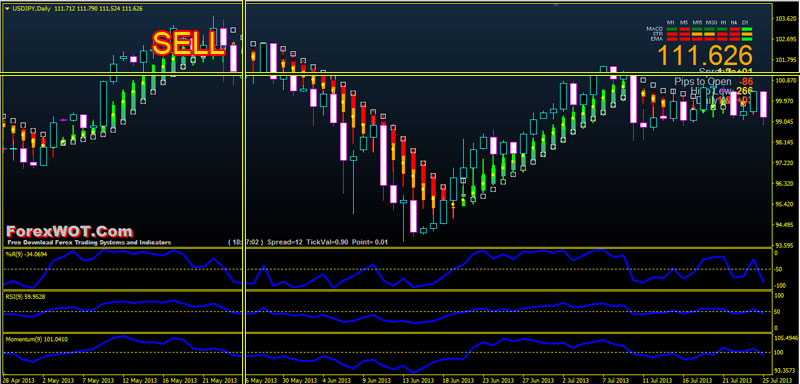
- Power price action (Red color)
- Power price action 2 (Red color)
- RSI line downward below 50 level
- Williams’Percent Range line downward below -50 level
- Momentum MT4 line downward below 100 level
- Place initial stop loss above/below the previous swing with Risk Reward Ratio 1:3.
- You can use this strategy also for trading intraday with support and resistance.
 How Do I Become a Good and Prifitable Forex Trader
 High Accuracy Volty Channel Stop RSI Trading Strategy and How to Win Consistently in Forex Trading
 Forex and Crypto “MORNING TRADE” Trading Strategy for Advanced Traders
 Forex Bill Williams Market Facilitation Index (BW MFI) Multi Trend Trading System and Strategy
 High Probability Trading: The 10 Pips Forex Trading Strategy
 Foreign Exchange Trading : Online Forex Master Level Trading System and Strategy
 5 Minute Chart Surefire RSI-CCI Forex Trading System and Strategy
 3 Best AMAZING Forex Trend Trading Strategy
 EASY Forex H1 IntraDay Trading System With Bill Williams Alligator Multi Trend Signal
 Forex Magic Breakout EMA CCI Trading – Maximize Your Profits and Achieve Exponential Earnings
