Bollinger Bands Forex Trading Strategy – Bollinger Bands® are a technical chart indicator popular among traders across several financial markets. On a chart, Bollinger Bands® are two “bands” that sandwich the market price. Many traders use them primarily to determine overbought and oversold levels.

One common strategy is to sell when the price touches the upper Bollinger Band® and buy when it hits the lower Bollinger Band®. This technique generally works well in markets that bounce around in a consistent range, also called range-bound markets. In this type of market, the price bounces off the Bollinger Bands® like a ball bouncing between two walls.
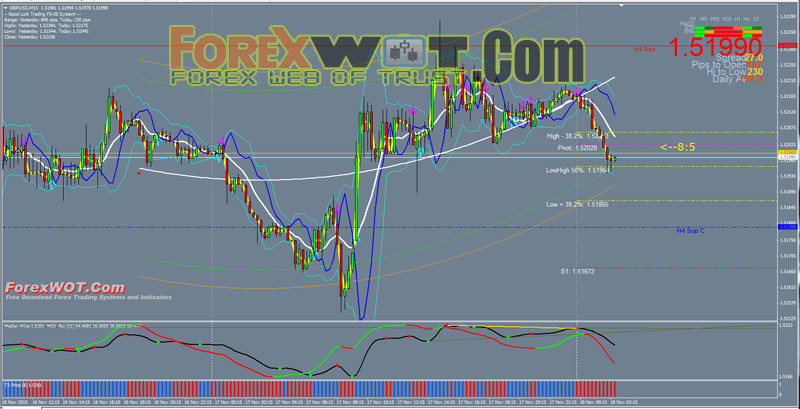
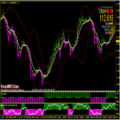
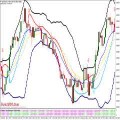
Trend Power System is an indicator strategy with dynamic channel support / resistance levels. Can be used on any currency pairs and all time frames. But I would still prefer the H1. There, I think, more reliable signals.
- Currency pairs: Any, recommended Major
- Trading Time: European session and Around the clock for H1 and higher
- Timeframe: M5 or higher, recommended H1
- Currency pairs: majors (example: EUR/USD, GBP/USD, AUD/USD, USD/CHF, USD/CAD, GBP/JPY, EUR/JPY, AUD/NZD)
- Appeared Trend Power Visual (better if at this time the price is near the bottom of the green line of the channel). Yellow star Trend Power Visual indicates a strong signal.
- The price touches the upper Bollinger Bands.
- Yellow Mirror Band across White and Blue Mirror Band lines.
- Median price up trend
- T3 Price bars blue
- Signal Bars green

Exit, when a signal of the opposite, when you see a red arrow or the price reaches the upper green channel boundaries.
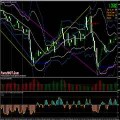
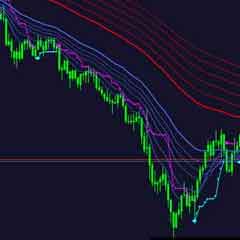
- Appeared Trend Power Visual (better if at this time the price is near the top of the green line of the channel). Yellow star Trend Power Visual indicates a strong signal.
- The price touches the lower Bollinger Bands.
- Yellow Mirror Band across White and Blue Mirror Band lines.
- Median price down trend
- T3 Price bars red
- Signal Bars red

Exit, when a signal of the opposite, when you see a blue arrow or the price reaches the bottom of the green border of the channel.
 TOP 10 Best Bollinger Bands Forex Trading System and Strategy
 FREE DOWNLOAD Top 10 Forex Currency Trading Systems With Bollinger Bands Indicator
 2 MACD Effortless Forex & Stocks Swing Trading Strategy
 Forex Day Trading – Secrets Bollinger Bands Forex Trading System Reveal
 ForexWOT BBMA – The Best Bollinger Bands Moving Average Trading System
 Forex Trend Trading Tricks Of The Successful Forex Trader
 How to Trade Forex Bollinger Bands with Zigzag and Commodity Channel Index (CCI) in Forex
 Forex Bollinger Bands Price Action Trading System and Strategy
 Forex Bollinger Bands Trading System with 4 Time Frame Gann Hilo Indicator (GANN)
 Forex Made Easy – Cynthia’s Exponential MA Forex Trading System
