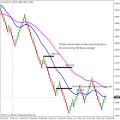
High Accuracy Renko Bar Chart Trading System. I will tell how to Correctly Identify Forex Trend with Renko Bar Chart Trading System – You might be familiar with renko charts. These are simply boxes that are plotted when price closes an “x” number of pips above or below the previous close.

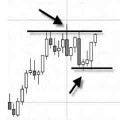
This charting methodology differs from the more traditional candlestick or bar charts. So while you might find renko charts to be different in their appearance, they have a unique capability of showing you the trends as well as help you to easily identify support and resistance levels.
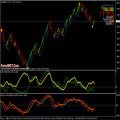
“Momentum” indicator in general refers to prices continuing to trend. The momentum indicator show trend by remaining positive while an uptrend is sustained, or negative while a downtrend is sustained.
A crossing up through zero may be used as a signal to buy, or a crossing down through zero as a signal to sell. How high (or how low when negative) the indicators get shows how strong the trend is.
The conventional interpretation is to use momentum as a trend-following indicator. This means that when the indicator peaks and begins to descend, it can be considered a sell signal. The opposite conditions can be interpreted when the indicator bottoms out and begins to rise.
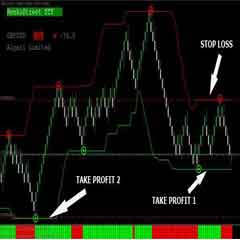
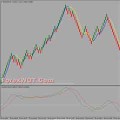
A renko chart is constructed by placing a brick in the next column once the price surpasses the top or bottom of the previous brick by a predefined amount. Renko Blue bricks are used when the direction of the trend is up, while Renko Red Bricks are used when the trend is down… And now, let’s go to the rules.
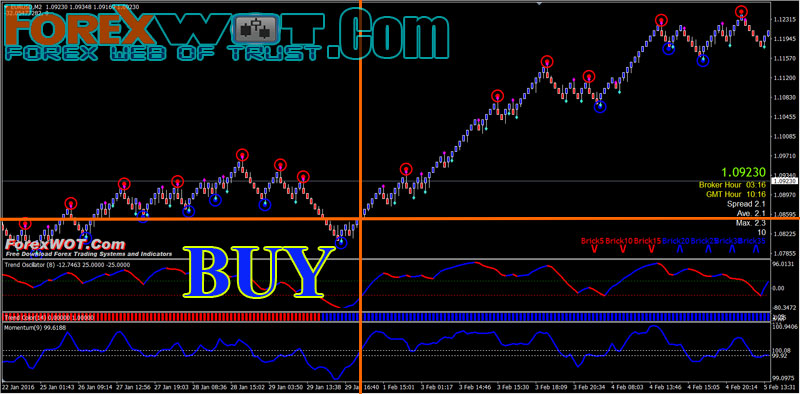
- Renko Blue Bricks
- Blue reversal point below previous renko bars
- Trend Oscillator upward and blue color
- Trend Color Blue
- Momentum line upward above 100.08 vertical line
- All bricks blue
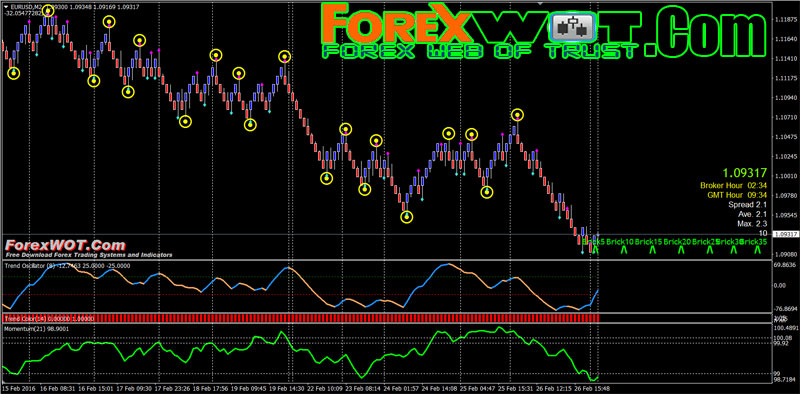
- Renko Red Bricks
- Red reversal point above previous renko bars
- Trend Oscillator downward and red color
- Trend Color Red
- Momentum line downward below 100.08 vertical line
- All bricks red

It is important to note that new bricks are only added when price movements completely “fill” the predetermined “brick size”. Prices may exceed the values of the previous brick (either above or below), however a new brick will not be formed until the price movement is large enough. For example, let’s say the brick size is set to 2 points and the last brick covers prices of $52 to $54. The new brick won’t be formed until prices close either at or above $56 or at or below $50. If price closes above $56, for example $57; the new brick must still stop at $56.
There are two rules regarding brick placement:
- Bricks will always have their corners touching.
- There can never be more than one brick in any one vertical column.
Traders who use Renko charts typically do so because they are easy to use and interpret. They are also different than a typical candlestick chart because they filter out all other variables besides price movement. There are many uses for Renko Charts. Some of the more popular are; discovering basic support and resistance levels, breakouts, and generating signals with additional forex basic or custom indicators.
[sociallocker]
[/sociallocker]
 Best Forex Renko Total System and Indicators (Advanced RENKO SYSTEM)
 Forex & Stocks Trading Strategy with RENKO MAKER PRO System
 Top 5 Best Forex Renko Trading Systems and Strategy
 How to Make Money Trading Forex Easily with Renko MACD Mirror Trading System
 Mapping Forex Price Action Trading Strategy
 FREE DOWNLOAD 20+ Best Forex MACD-Moving Average Trading System
 Highly Profitable Renko Street Trading System
 Top 7 Best Forex Trading Success Rules To Profit
 Simple Forex Renko System – Making Money in Forex is Easy if You Know How
 BEST Professional Renko Channel Forex Trading System & Technical Analysis

I can download this system but it not look like on this web why?
Thank you veeeeeeeeeeeeeeery
Hi Ghanim, Thanks for all your support – please share it with others =D