Forex & Bitcoin Online Traders need market movements to be successful. There cannot be any profits unless there is movement.

When markets move strongly in one direction or the other, this is referred to as a TREND.
If there is no trend and little or no movement of prices, it is more than difficult to trade successfully.
It is therefore important to identify existing trends. So-called TREND LINES are one of the most fundamental concepts in technical analysis.
On the one hand, they provide clues to where prices might be headed, and on the other hand, they are a warning signal that appears whenever prices stray from the “right path”.
While they are mainly suitable for longer time frames (swing trading, for example) and less for shorter ones (day trading), one should be familiar with the principles of this theory since trend lines are relatively easy to use and frequently send reliable buy or sell signals.
An upward trend line is obtained by connecting the first low point (the historically older price quotation) to another low point (the historically younger price quotation) of a price with the latter one having to be higher than the former.
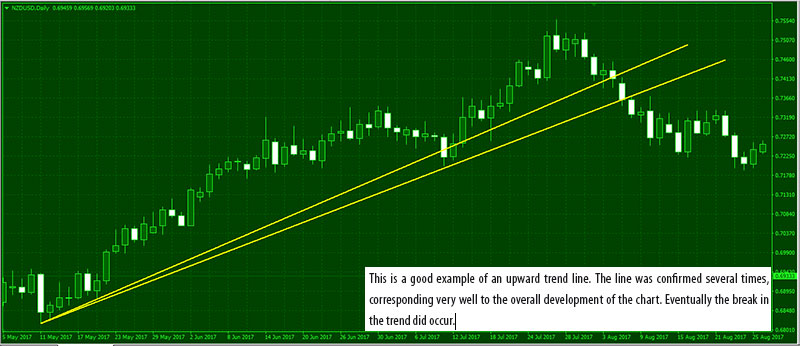
Rising trend lines are considered to be a support.
The more points of support the marked trend line has, the more significant it is itself and the more support there is.
That is why trend lines with only two points of support should at least be confirmed by a third one in order to be considered by the trader as a possible future entry point.
- The upward trend will be intact as long as prices are quoted above the trend line.
- The upward trend will be broken once the price crosses the upward trend line downwards.
The rules governing the upward trend line only need to be reversed accordingly.
This means that a downward trend line is obtained by connecting the first high point to at least one other high point of a security with the latter one having to be lower than the former.
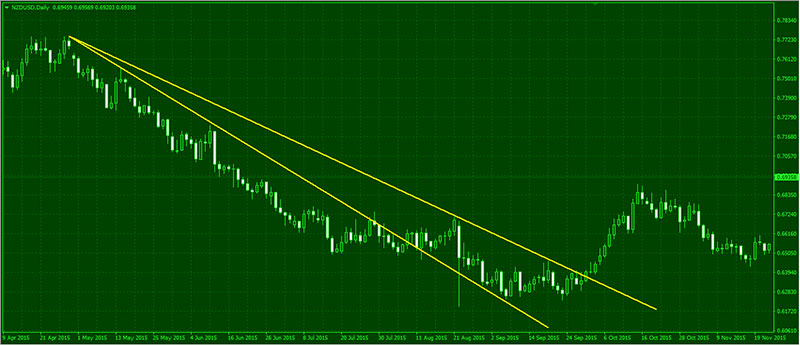
Following a change in trend, falling trend lines function as resistance and imply continuing falling prices.
As long as prices are quoted below the trend line, the DOWNWARD TREND is intact.
However, it will be broken once the price crosses the downward trend upwards, leading in turn to a change in trend.
When prices do not reveal an upwards or downwards trend, they move sideways. Such sideways phases may also be described as a trend – sideways trends.
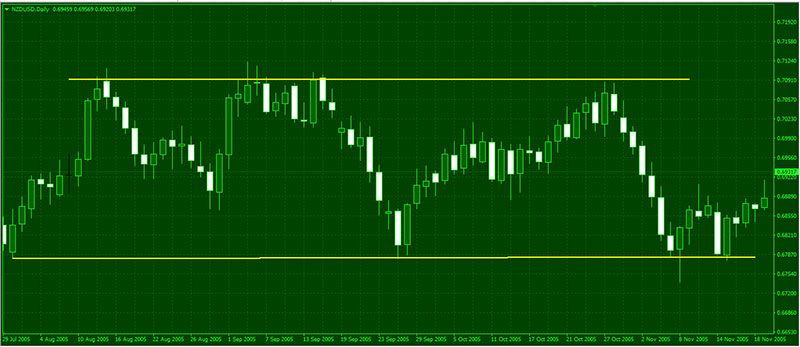
For further price development, they also contain a support or resistance function which the trader can utilize.
These so-called trading ranges are of interest to traders because you can also buy or sell within this trading range since the price moves back and forth within it and is, therefore “predictable“.
Most of the time there is a MIDDLE LINE within a trading range.
If this is broken from the bottom to the top, a test of the upper resistance line is likely, but if it is broken from the top to the bottom a test of the support line is likely.
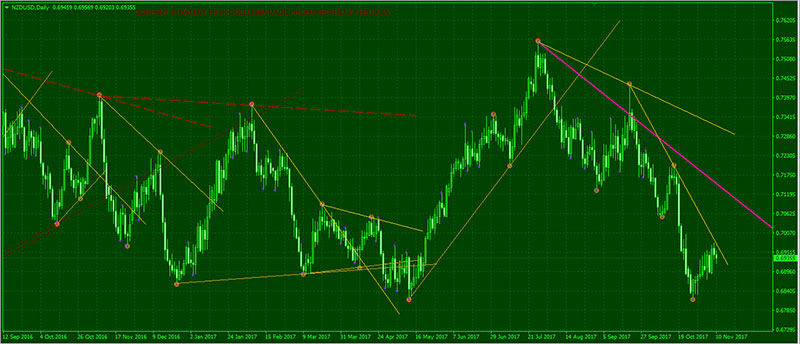
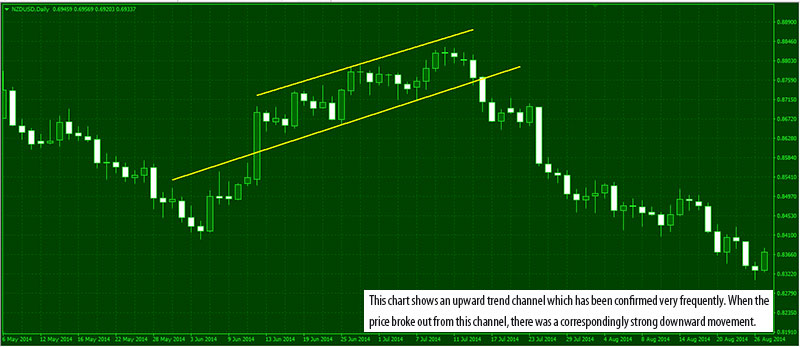
Trend channels consist of two parallel trend lines.
This means that they do not just indicate the approximate direction of the trend but also the price range to be expected, which may allow excellent entry and exit prices to be marked.
An upward Trend Line Channel is obtained by a line running parallel to the upward trend line, and that line consists of the first high point combined with at least another high point of the price.
The downward or sideways trend channel is determined analogously.
Prices move back and forth between the upper and lower edge of the trend channel. If the latter is left upwards or downwards, then this is a sign of a change in trend and a new definition.
If there is neither an upward nor a downward trend, we have a sideways trend.
This trend is attractive as soon as it is left since there may well then be a movement that causes the price to move far away from the sideways trend, leading to attractive trading opportunities.
However, price fluctuations may also be effectively utilized within the sideways trend.
Such trend lines and trend channels, while being more suitable for longer-term periods, may be created for any time frame.
Depending on how you look at it, a distinction is made between different trends as a function of time frames.
The Long-term trend is described as a PRIMARY TREND, which can then be subdivided into secondary trends, within which, in turn, further tertiary trends may appear.
What can frequently be read is that such categorization should be tied to periods of time relatively rigidly.
A primary trend, for example, would then be a trend on a monthly basis, a secondary trend one on a weekly basis, and a tertiary trend one on a daily basis.
Trend lines are among the most important and effective instruments of chart-based technical analysis.
For this reason, they ought to be watched very closely, especially when broken by the price.
Such trend change signals are often good BUY or SELL signals.
However, no immediate action should be taken whenever there is a minor break and prices are only slightly below the trend lines since these might be short-lived.
It is only a sustained break that forces the trader to act.
 How Do I Become a Good and Prifitable Forex Trader
 Foreign Exchange Currency Trading & Investment Strategy – Forex Z 20 System for Successful and Highly Profitable Forex Trader
 High Accuracy Volty Channel Stop RSI Trading Strategy and How to Win Consistently in Forex Trading
 Best Forex & Stocks Trading Strategy with Dolly-Graphics System
 Forex Bill Williams Market Facilitation Index (BW MFI) Multi Trend Trading System and Strategy
 High Probability Trading: The 10 Pips Forex Trading Strategy
 Sure Forex Breakout System Absolutely Amazing and Easy Forex Strategy
 Forex and Crypto “MORNING TRADE” Trading Strategy for Advanced Traders
 EASY Forex H1 IntraDay Trading System With Bill Williams Alligator Multi Trend Signal
 Simple Powerful and Effective Forex Price Action Trading Strategy Using Moving Average
