Dolly FxGraphics This indicator has had a total rebuild and now works with the new extra digit platforms. Some examples of the built in color displays are shown on the above screenshot.

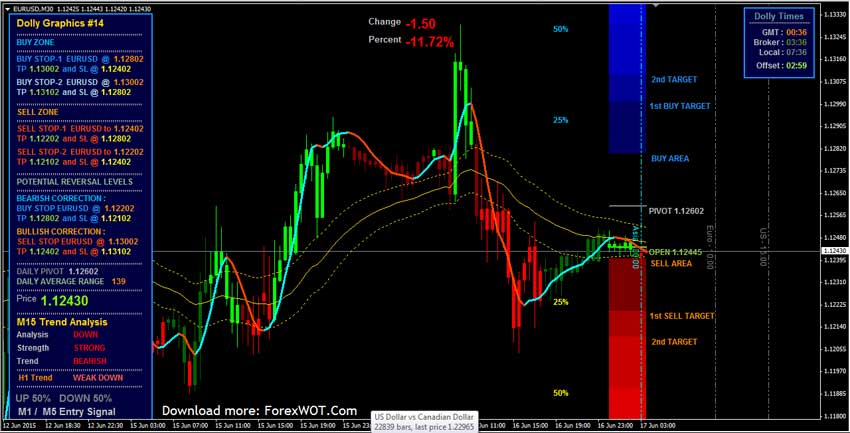
Dolly now also has Murrey Math 3 MA displays and Bands plus trading signals and many more features built into the code.
Most important is the user needs to check the Allow DLL imports tab and put a Password into the Dolly inputs before it will work. Dolly FxGraphics Password = FREE_at_tsd
MACD Candles
This indicator has had a few revisions of the code and the MTF display can be altered for size and shifted anywhere on the chart.
The most important update is to the candle color code, in this indicator there is no need to go into the inputs to alter the candle color width as with most colored candle indicators, with the latest update the candle size now updates on the first new tick or you can click on refresh, this version also has an option to use a fixed manual candle size if required as sometimes when many charts are displayed in a single window it is possible for the automatic candle size to be unable to compenstate for the candle size accurately.
Price Display
This indicator has several display features the user can select 2 different types of moving Price displays in the form of a Price Box or a simple Price label and a static Price Display all of which can be altered for size.
The Price color code has been updated to the latest type of code giving a faster response to Price changes.
Multi Range Calculator
This indicator now has an on chart display of the LONG and SHORT SL levels and plots the timeframe Average range at 50% above and below the Open to give an indication of the expected price range for the selected timeframe.
The screenshots shows the Daily Average SL levels however on the chart which displays the 3 Multi Range Calculator indicators Daily / H4 / H1 timeframes all of the SL’s for each timeframe or any combination of the 3 timeframes could be dispalyed on the chart at the same time.
VisualTrend HMA
This indicator can be set to show Standard Candles or Heiken Ashi Candles ( NOTE: The standard Heiken ashi indicator must be in your MT4 indicator folder for this indicator to work ) and shows a visual Multi Timeframe display of the position of the current candles for each Timeframe and makes determining the Trend and current Price direction easier.
The VisualTrend indicator now has extra display features such as Candle high/Low data and Time frame labels to easliy identify each candle plus a new selection of color inputs for better user control of the display.
Session_HiLo
This indicator shows a visual display of the various Trading Sessions with options to display the session price range in pips and best trading zones for each individual session.
With the version 4 update traders can now set the session times starting before Midnight and across into the next day. All the session zones can be altered to suit your broker GMT offset and the line colors styles and labels can all be altered to suit your own trading style.
Drag & Drop remove TP & SL script
Drag this script onto any order Open price on a chart and it will delete the Stoploss and Takeprofit levels for that order.
Drag & Drop TP & SL script
Drag this script onto any order Open price on a chart and it will add the Stoploss and Takeprofit levels for that order.
Drag & Drop Pending Straddle
Drag this script onto the Bid Price on a chart and it will place two orders in a straddle either side of the Bid and if selected it will also place the Stoploss and Takeprofit levels for that order.
DropLabel
DropLabel script
Drag this script onto any point on a chart and it will place a label. The trader also has the option to use automatic random colors for the text or can select their own colors
DropPrice
DropPrice script
Drag this script onto any point on a chart and it will place a left or right positioned Price Box. The trader also has the option to use automatic random colors for the text or can select their own colors.
 20 Halloween Costumes From Amazon All Traders will Actually Want To Wear
 Forex & Stocks Trading Strategy with EMA-MACD Trend Dominator System
 2 MACD Effortless Forex & Stocks Swing Trading Strategy
 FREE DOWNLOAD 20+ Best Forex MACD-Moving Average Trading System
 Forex and Crypto “MORNING TRADE” Trading Strategy for Advanced Traders
 MA COBRA Forex & Stocks Trading Strategy (Extremely Low Risk High Reward Trading Strategy) (COBRA SYSTEM)
 Complete Guide To Forex Trading : Forex Long Term or Short Term Trading Strategy
 TOP10 BEST Full Time Forex Trader Trading System and Strategy
 Top 10 High Accuracy Forex Stochastic Trading Strategy
 FREE DOWNLOAD Top 10+ Best Forex Trading Systems for Beginners

best indicator
Good, The best indicator
good