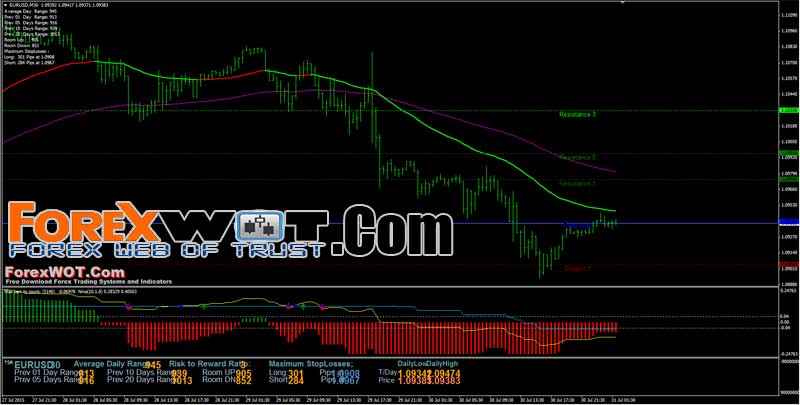
A Simple Guide for Using the Popular Moving Averages in Forex. CatFX50 (EMA 120 – EMA 50) easy forex system is a winning one, but it is not a Holy Grail nor a money machine. Use common sense.

Do not forget that CatFX50 has not an exit strategy. Therefore, and it is mandatory, you need to know your risk/reward ratio before placing a trade.
I make daily recaps of the signals CatFX50 gives. These recaps can be deceptive, because you see the huge amount of pips the system generates every single day.
But no one can take them all. It is impossible. Do not forget that. Maybe, someday, a very smart trader will find the way to grab them all. Since then, take care and good luck!!!
Buy when price crosses EMA 50 and new bar opens above. Hist_StepMA_Stoch must be green. Sell when price crosses EMA 50 and new bar opens below. Hist_StepMA_Stoch must be red. If price and Hist_StepMA_Stoch crosses are simultaneous, the better.
For instance, when price is above EMA 50 with Hist_StepMA_Stoch in green. Price then opens one bar at least below EMA 50 and Hist_StepMA_Stoch keeps in green mode. When price opens again above EMA 50 with Hist_StepMA_Stoch validating (green), we can buy. The opposite for a sell.
For instance, we are in bullish mode: price above EMA 50 and Hist_StepMA_Stoch in green. Suddenly, price goes down crossing or without crossing EMA 50 and obviously without opening below it. Hist_StepMA_Stoch changes to red. We buy when price goes up again always validated by Hist_StepMA_Stoch that should change to green again.
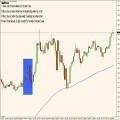
Level 4 is when price, after a consolidation of a few bars, breaks through the last high or low. The main thing we need is an indication of strength, and if we don’t get it, it could be a trap! Obviously, the breakout down should have Hist_StepMa_Stoch in red and green for the opposite.

On Level 3 the price doesn’t have to cross the EMA50 line The other difference is that Hist_StepMA_Stoch briefly changes color
Notice the price breakout in the illustration? It would be hard to ignore, wouldn’t it?
You don’t have to wait for the price to close to do the trade, get on board and ride that baby!
Pairs to trade: EURUSD, USDCHF and GBPUSD. When bar opens more than 20 pips above/below EMA 50, the signal is riskier.
Do not buy/sell, for instance, EURUSD because GBPUSD has a signal. Wait for the signal to come in each pair you want to trade. Look at EURGBP, USDCHF and US Dollar Index always.
We can not jump in a trade without knowing the amount of pips we expect to make. We can not know that seriously without a stop loss. The stop loss will tell us what we should expect according to the Risk/Reward ratio we use.
For instance, we get a validated signal to buy EURUSD at 1.2700. We decide to go with 1 standard lot. OK, where do we place the stop loss? A common and today useless stop loss is 34 pips. So, we are risking 34 pips, that is $340.
If we do not want to gamble, we should expect to make $690 at least. That is 69 pips or 2:1 R/R. But the optimum R/R is 3:1. That is $1030 or 103 pips.
EURUSD has usually a daily range between 60 and 80 pips. It is clear that we will not be able to make those 103 pips in the majority of cases.
Then, what’s the point of using a fixed stop loss of 34 pips? We should not do that if we want to keep our money. So, we need to place a stop loss according to the risk and reward we assume and expect.
Well, you could say, as I want a 3:1, I place the stop loss 5 pips below entry. That is, I’m risking 5 pips to make 15. Great!!! But this does not work that way, sorry.
We use charts because we think they tell us what to do according to what price has done. If we use a s/l of 5 pips without looking at what price has done before we get the signal, we are not trading, but betting. What to do, then?
We need to look at what price has done during the previous bars. They will tell us where to place the stop loss. If the “logic” stop loss we get is too high according to what we expect, we should not take that signal.
So, lets say it is 17:30cet and we get a signal to buy EURUSD. The stop loss we need to use is 15 pips and EURUSD has only 10 pips to go up according to its daily range. Do we take it?
But, you could say: “Daily ranges break sometimes”. Yes, they do. You said it: sometimes.
We should not forget that if we scale during the trade, our risk/reward ratio changes, because we acceped a risk at the beginning of the trade according to a assumed reward we will not get; as the reward will not be the same at the end of the trade if we have taken partial profits during its development.
 How Do I Become a Good and Prifitable Forex Trader
 Foreign Exchange Currency Trading & Investment Strategy – Forex Z 20 System for Successful and Highly Profitable Forex Trader
 Forex and Crypto “MORNING TRADE” Trading Strategy for Advanced Traders
 High Accuracy Volty Channel Stop RSI Trading Strategy and How to Win Consistently in Forex Trading
 Complete Guide To Forex Trading : Forex Long Term or Short Term Trading Strategy
 High Probability Trading: The 10 Pips Forex Trading Strategy
 Best Forex & Stocks Trading Strategy with Dolly-Graphics System
 Sure Forex Breakout System Absolutely Amazing and Easy Forex Strategy
 2 MACD Effortless Forex & Stocks Swing Trading Strategy
 Forex Bill Williams Market Facilitation Index (BW MFI) Multi Trend Trading System and Strategy
