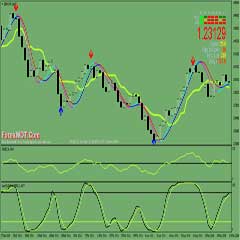
The arrows indicator is designed to be used with Forbi Moderate Swing and Trend Forex Trading System. Doesn‘t matter if you will use custom or general indicators while trading this system, you can use arrows indicators to confirm entry and exit points while trading Forbi Moderate Swing and Trend trading system.


It is highly advised to read this manual before trading. Because of the specifics of arrows indicator algorithm the arrows can sometimes provide a false entry signal (like trading against trend or trading in flat market), so you should always follow the rules provided in this manual and use arrows indicator as a confirmation of the rules, and never trade against the rules.
Here is a full description of a trading system we will be using. After learning how the system is used, it will be easier to interpretate custom indicators.
The Trading system is based on 4 indicators:
- 2 varations of fast exponential moving averages sliding (called Exponential Moving Average, EMA),
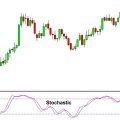
- stochastic indicator (called Stochastic), and
- the relative strength index (called Relative Strength Index, RSI) and Commodity Channel Index (CCI).
The system can be adapted to any currency pair offered at different time periods.
Used indicators:
- EMA 5 preriod, EMA 10 period,
- standard setting Stochastic (K: 14, D: 3,Slowing: 3)
- RSI (period 14, levels: 70,30) and
- CCI (period 50).
All indicators should be based on typical price (HLC/3) you will find such option in indicators properties on MT4 and MT5 platforms.
Filter indicator:
Bollinger Bands (period 50). Avoid trading if Bollinger bands are narrow and continue to be narrow. You might miss the first trade when Bollinger bands begin widening, but you will have successful later trades.
To get a better picture if Bollinger Bands are too narrow to trade upscale the picture. Normally night time will have narrowest bollinger bands.
The main principle of trading in the financial markets – to understand the indicators when you open positions. Use these indicators to confirm a high probability of successful trades.
This particular trading strategy will show you trading oppurtunities in two market conditions: trending market and volatile market. We will use the same indicators, but interpretation will be a little bit different.
1. TRENDING MARKET
Firstly we need to identify trending market. Lets talk about bullish trending market. We are seeking for such trending conditions:
Bollinger bands:
Both lower and upper bands are going towards trend dirrection or at least they are not widening extremely (we need to avoid jumping into gap).
CCI:
This indicator stays somewhere between levels 50 and 150 for good trend and between 0 and 100 for lower trend. Extremes, such as level of 300, might be followed by price consolidation and trend ending, so we need to wait through at least 10 candles or enter a trade with a risk of a small loss.
RSI:
this signal stays over 50 line.
THE SIGNALS:
Open Buy:
- EMA5 crosses EMA10 from below to upper direction,
- RSI comes close to 50 line and then goes up or crosses 50 line from above and than crosses back to upper direction and
- Stochastic direction is up (if Stochastic is at low level – very good, but often it will be around level of 80, as price is trending up) and CCI comes close to level of 0 and goes back upwards.
Important: sometimes EMA5 doesn‘t cross EMA10, just comes close and continue accelerating up.
Thats trend continuation follow – other indicator‘s signals.
Close Buy:
- EMA5 crosses EMA10 from above to lower direction or
- RSI crosses 50 line from above to lower direction or
- Stochastic crosses level of 80 from above to lower direction.
Important note: in strong trend* conditions, close signals (1) and (3) might fail and the trend will continue. Re-enter trade when Stochastic reverses from lower to upper direction and EMA5 crosses EMA10 to the upper direction to maximise your profits.
Open Sell:
- EMA5 crosses EMA10 from above to lover direction,
- RSI comes close to 50 line and then goes down or crosses 50 line from below and than crosses back to lower direction and
- Stochastic direction is down (if Stochastic is at high level – very good, but often it will be around level of 20, as price is trending down) and CCI comes close to level of 0 and goes back downward.
Important: sometimes EMA5 doesn‘t cross EMA10, just comes close and continue accelerating down.
Thats trend continuation – follow other indicator‘s signals.
Close sell:
- EMA5 crosses EMA10 from below to upper direction or
- RSI crosses 50 line from below to upper direction or
- Stochastic crosses level of 20 from below to upper direction.
Important note: in strong trend* conditions, close signals (1) and (3) might fail and the trend will continue. Re-enter trade when Stochastic reverses from upper to lower direction and EMA5 crosses EMA10 to the upper direction to maximise your profits.
IMPORTANT: to avoid false signals we recommend opening positions only after the candle is closed and signal is comfirmed. Opening a position in advance might fail if price gap occurs.
2. VOLATILE MARKET
We will identify volatile market:
- Bollinger bands: very wide or visibly wider compared to last flat period.
- CCI: levels of this indicator are far from 0 line and changing consistently to any direction.
- RSI: levels of this indicator are below 40 or above 60, changing direction. We avoid trading if it stays somewhere around level of 50, as it indicate price consolidation or flat market.
Scenario 1 – moderate swings
Open buy:
- EMA5 crosses EMA10 from below to upper direction,
- RSI crosses 50 line from below to upper direction and
- Stochastic direction is up or just changed direction to up.
Important: if Stochastic indicator meets buy conditions, one of (1) and (2) conditions are met and other are close to these conditions buy order also should be opened.
Close buy:
- EMA5 crosses EMA10 from above to lower direction or
- RSI crosses 50 line from above to lower direction or
- Stochastic crosses level of 80 from above to lower direction.
Open sell:
- EMA5 crosses EMA10 from upper to lower direction,
- RSI crosses 50 line from above to lower direction and
- Stochastic direction is down or just changed direction to down.
Important: if Stochastic indicator meets buy conditions, one of (1) and (2) conditions are met and other are close to these conditions sell order also should be opened.
Close sell:
- EMA5 crosses EMA10 from below to upper direction or
- RSI crosses 50 line from below to upper direction or
- Stochastic crosses level of 20 from below to upper direction.
Scenario 2 – seeking for extremes
Open buy:
- Price candles became far below both EMAs and current current candle touches EMA5,
- RSI reached level of around 30 or less and is reversing upwards and
- Stochastic is below 50 line and it‘s direction is up or just changed direction to up and (4) CCI reached level below -100 (optimal if below -200) and is reversing upwards.
Important: if Stochastic indicator meets buy conditions, one of (1) (2) and (4) conditions are met and other are close to these conditions buy order also should be opened.
Close buy:
- EMA5 crosses EMA10 from above to lower direction or
- RSI crosses 50 line from above to lower direction or reached level of about 50 and reverses downwards or
- Stochastic crosses level of 80 from above to lower direction.
Open sell:
- Price candles became far above both EMAs and current current candle touches EMA5,
- RSI reached level of around 70 or more and is reversing downwards and
- Stochastic is above 50 line and it‘s direction is down or just changed direction to downwards and
- CCI reached level above 100 (optimal if above 200) and is reversing downwards.
Important: if Stochastic indicator meets buy conditions, one of (1) (2) and (4) conditions are met and other are close to these conditions sell order also should be opened.
Close sell:
- EMA5 crosses EMA10 from bellow to upper direction or
- RSI crosses 50 line from below to upper direction or reached level of about 50 and reverses upwards or
- Stochastic crosses level of 20 from below to upper direction.
EXAMPLES:

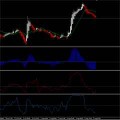
This example is EUR/USD pair, M5 timeframe, date 2012 Jul 11.
Before first trade we missed quite nice trade oppurtunite, because Bollinger Bands indicated flat market.
So we start with the first trade: this is moderate swing trade, CCI and Stochastic confirmed the trade, while RSI and EMAs were about to confirm the trade on past candle, so we enter at the next candle opening. Exit confirmed by stochastic.
Second trade: market became volatile, indicated by bollinger bands. In thi case we see CCI and RSI extreme. We enter trade on next candle after the signals are confirmed. Exit is indicated by RSI crossing 50 line upwards.
Third trade: Bollinger bands and CCI indicates trending market. CCI comes close to level of 0 and RSI crosses 50 line down and then crosses back upwards, while Stochastic and EMAs confirm the trade. Exit is indicated by Stochastic.
Fourth trade: all indicators indicate moderate swing trade, while Bollinger bands stays wide indicating volatile market, so we enter at the next candle.
Exit is indicated by Stochastic.
Fifth trade: here we see either „seeking for extreme“ moderate swing trade situation. Seeking for extreme situation suggests entering the trade one candle earlier, although entering later would still be profitable. Exit is indicated by Stochastic.
Sixt trade: the trade is still running as I am writing explanation now. This is normal moderate swing trade, all indicator confirms that so we enter at the next candle after confirmation.
Between trades 2 and 3 there is quite confusing situation. All signals are likely to confirm buy trade, BUT: Bollinger bands indicates trending market. But in trending market for a possitive trade, we need CCI to stay around level of 100, not being in extremes few candles earlier.
In this situation we see that CCI just recovered from extreme of over 320, so it is dangerous time to take early trade. Anyway, if by mistake we would have taken this trade, the loss would be minor, compared with all other profitable trades.
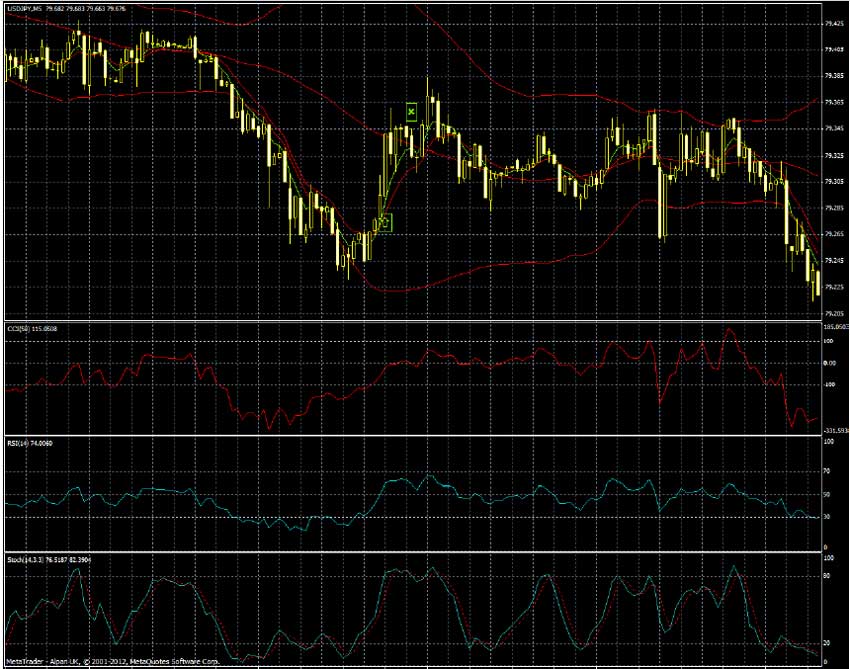
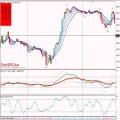
This example is USD/JPY pair, M5 timeframe, date 2012 Jul 11.
We can see that we miss strong short-term downtrend as the market was flat and we have no re-enter signals here so entering somewhere in the middle would be to riski, as trend can end any time.
So we have one trade: market becomes volatile, indicated by Bollinger bands, and all indicators indicate normal moderate swing trade so we enter buy trade. Exit is indicated by Stochastic. After that price consolidation follows, indicated by Bollinger bands, so we do not trade then.

This example is USD/JPY pair, M5 timeframe, date 2012 Jul 11.
Here we see the market becomes volatile and trending.
First trade is indicated by all indicators according to trending market rules. First stop is indicated by RSI. We stoped that out with small loss of about 1 pip, and after that we can re-enter trade, as all indicators confirms trend continuation. Exit is indicated by Stochastic. After that narrowing Bollinger bands indicate slowing market, so we do not trade.
Second trade: market becomes volatile again, indicated by Bollinger bands, so we enter the trade according tomoderate swing trade rules: RSI crosses 50 line upwards, Stochastic going upwards, EMA5 crossed EMA10 upwards and CCI is about to cross 0 line upwards. This trade is the lucky one – we catched strong uptrend. Exit is indicated by Stochastic.
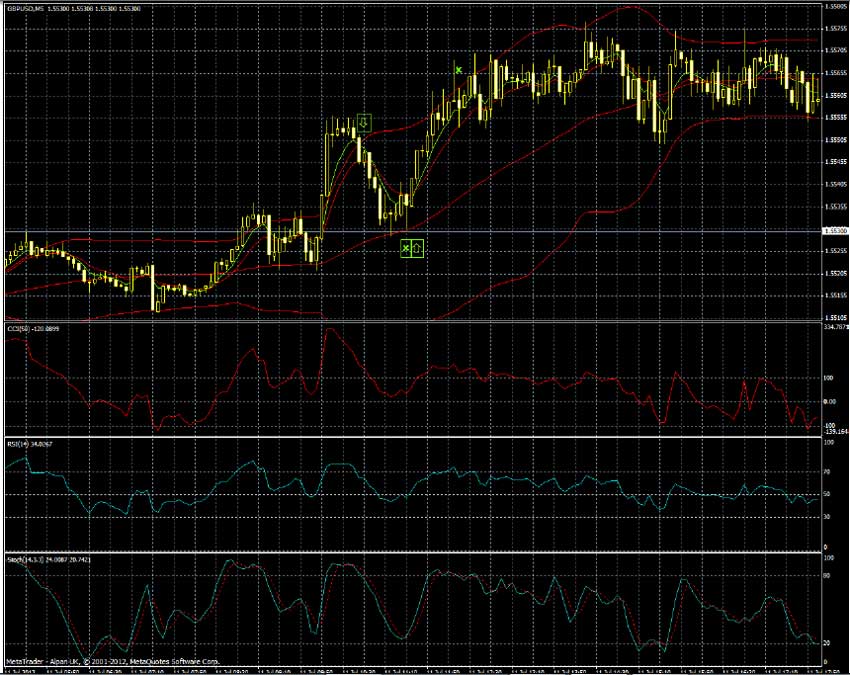
This example is GPD/USD pair, M5 timeframe, date 2012 Jul 11.
The market becomes volatile suddenly – we miss first trade, as we don‘t know how long the market continue trending up.
First trade: after Bollinger bands confirm that the market became volatile, we apply „seeking for extremes“ rule as all signals confirm that. Exit is indicated by RSI.
Second trade: trend continuation. While signals confirm entering buy trend for trend catching, CCI indicates risk of price consolidation and the end of the trade. So we enter this trade with a risk of a small loss. Exit is indicated by Stochastic.
 Foreign Exchange Trading : Online Forex Master Level Trading System and Strategy
 2 MACD Effortless Forex & Stocks Swing Trading Strategy
 How to Become A Successful Forex Trader and Make BIG Money With Easy Stochastic Oscillator-RSI Trading System
 MA COBRA Forex & Stocks Trading Strategy (Extremely Low Risk High Reward Trading Strategy) (COBRA SYSTEM)
 Top 10 High Accuracy Forex Stochastic Trading Strategy
 How to Use Stochastic Oscillator to Create a Forex Trading System & Strategy
 Forex RSI Trend Reversal Trading System With Rainbow Multi Moving Average (RSI)
 5 Minute Chart Surefire RSI-CCI Forex Trading System and Strategy
 3 Best AMAZING Forex Trend Trading Strategy
 RSI Momentum Secret Method Forex Trading System – Step by Step Tutorial

Hello and congratulations to your fantastic portfolio of information,
I am contacting you because I am searching for a bollinger bands indicator with alert.
The alert should be activated when the actual candle closes either above or below the middle band of the bb indicator.
Best Regards