This manual trading system is made of the global advancements in Forex trading and will be very profitable for you. This trading method will revolutionize how you trade, forever. The Breakout Trend Trading Simple System is color coded trading and is the easiest and least stressful trading you will ever do. Now trading can be fun, as it should be!

IMPORTANT: In order to achieve good results you must read AND FOLLOW THE MAJOR RULES BELOW!
- Recommended Time Frames: any
- Recommended pairs: strong volatile trending pairs. EX: I trade the NzdUsd, AudUsd, EurUsd, GbpUsd, EurJpy, GbpJpy and UsdCad during the London/NY sessions, and the EurAud, AudJpy, EurJpy, ChfJpy and GbpJpy during the Asian session.
- It is highly recommended to monitor economic news events at Forex Factory: http://www.forexfactory.com/calender.php
I look every Sunday to plan my trading week. Any red economic news events in my timezone can be traded in a 1 minute or 5 minute chart.
- Trade according to color. For the Advanced system, you will also be using a Triangle Breakout Indicator and a Fibonacci Heat Map that shows the red sell zone and blue buy zone and all the fib levels….everthing is automatically adjusted for you according to the price action.
- All colored signals need to be the same before you enter a new position. Do not enter a trade until the iTrend indicator crosses (in the lower window).
➔ Aggressive trades can be entered when the iTrend crosses and for the Trend Slope to be the same color as the Signal_Entry_Stop. (best for higher timeframes)
➔ Conservative trades should wait for the purple iTrend volatility line to cross up through the 60 rsi line and for the Trend Slope to be the same color as the Signal_Entry_Stop. (best for lower timeframes) - Use sensible money management.
- As with any trend trading system, you are looking for breakouts and trying to avoid consolidation periods of low volatility. To find the high volatility entries, we use the iTrend in combination with a special RSI volatility breakout box that I devised.
Of course not every trade will be profitable, there is no holy grail in Forex. Losing trades will be closed by your trailing stop loss automatically but by the end of the month a good profit is sure to be yours.
- Pick out 3-4 major trending pairs to trade (or only 2-3 pairs if your screen isn’t very wide)
- Make a Profile that has the 4 hr charts at the top going across and then a 1 hr chart under those going across and then a 15 min chart under the 1 hr charts going across
- Attach the “Cynthia advanced_simple_system” template to each chart (select your chart by clicking on it, then go to Charts, Template, Load Template and select the template….repeat for each chart).
- Add your Bonus Indicators to each chart if you like (they are the TrendWave and SuperTrend indicators located in your Custom Indicators) and save your new template by going to Charts, Template, Save Template, and name it “Cynthia_advanced_simple_system_bonus”.
- Next, save your chart setup as a Profile by going to File, Profiles, Save As, and name it “Cynthia_advanced_simple_system”.
Here is a screen shot that illustrates the profile setup with the Advanced indicators but without the bonus indicators:
You can set up your Profile charts with any pairs and any timeframes you like.
When you are looking at a currency pair to trade, you first look at the top 1 or 4 hr chart to determine the major trend.. then look down at the next chart underneath to see the medium trend, and then look down at the lower chart to see the faster trend.
I use a faster chart for better entries into a slower chart. EX: use a 15 min chart for better entries and exits according to the trend in a 1 hr or 4 hr chart. Or use a 5 -15 min chart for a better entry/exit while trading in a 1 hr chart. And use a 5 min chart for better entries/exits while trading in a 15 min chart.
At the far right is a dotted white vertical line that follows the price…. you can always quickly at a glance see where the price is at.
I only use a 5 min chart to trade news events….other than that, there’s too much noise and the whipsaw is too great during consolidation periods.
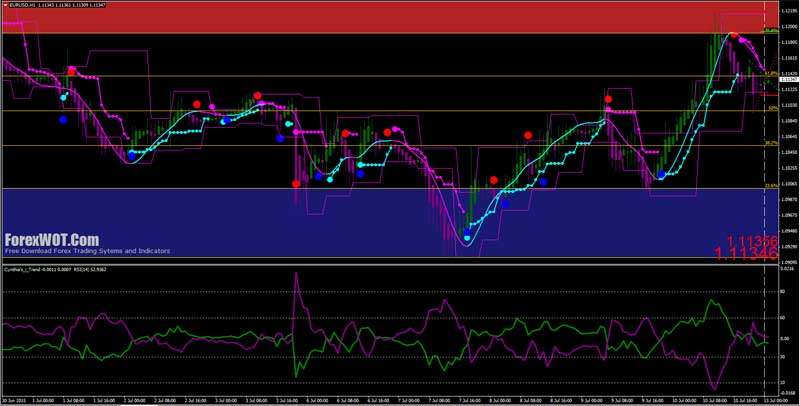
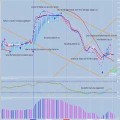
The Fibonacci Heat Map AKA Cynthia’s AutoFib TradeZones and Cynthia’s Triangle Breakout Indicators – Your Advanced Indicators
This screenshot shows you the Fibo Heat Map and the Triangle Breakout Advanced indicators as well as the bonus indicators.
The Triangle Breakout indicator, which gives you triangle support and resistance and your short term buy or sell targets, works great in conjunction with the fib lines. The heat map which is the red sell zone and the blue buy zone and the fib lines are automatically drawn by the indicator and adjust as the price changes when it hits a new high or low.
It’s hard to see in the screenshot, but the Fibonacci Heat Map shows you all the fibo percentage lines. Basically, if you sell from the red overbought zone, your ultimate target is 100% at the bottom of the blue zone. If you are buying from the blue oversold zone, your ultimate target would be the 0% at the top of the red zone.
However….
Price often hits the 38.2%, 50% and 61.8% levels. Your target can be those fib lines especially if the triangle targets are close. The Auto Fibo Heat Map will automatically plot all your fib lines…you just need to learn how to use them for price targets.
You should also learn how to use the fib lines for trading retracements. It’s never a straight shot from 100% to 0% and vice versa…the price moves, then re-traces and then moves again….you need to learn how to see the retracements, which is best done on a 15 min chart.
Fibonacci analysis is a LEADING INDICATOR. What this means is that you can use the fib levels to determine the probable turning points in the market before the price gets there! Yes, in advance!
This means that it predicts future price movements rather than analyzing past movements oraverages. The future is what we need to know when we are trading, so this gives this method anadvantage over other chart analysis systems from the get go.
Fibonacci retracements or extension targets offer a high degree of precision and may be used as leading indicators. If you are interested in knowing how to increase your profits in forex trading, then you’d be interested in Fibonacci analysis because professional traders are responding to Fibonacci levels. Fibonacci levels become a self fulfilling prophecy because so many traders are reacting to them.
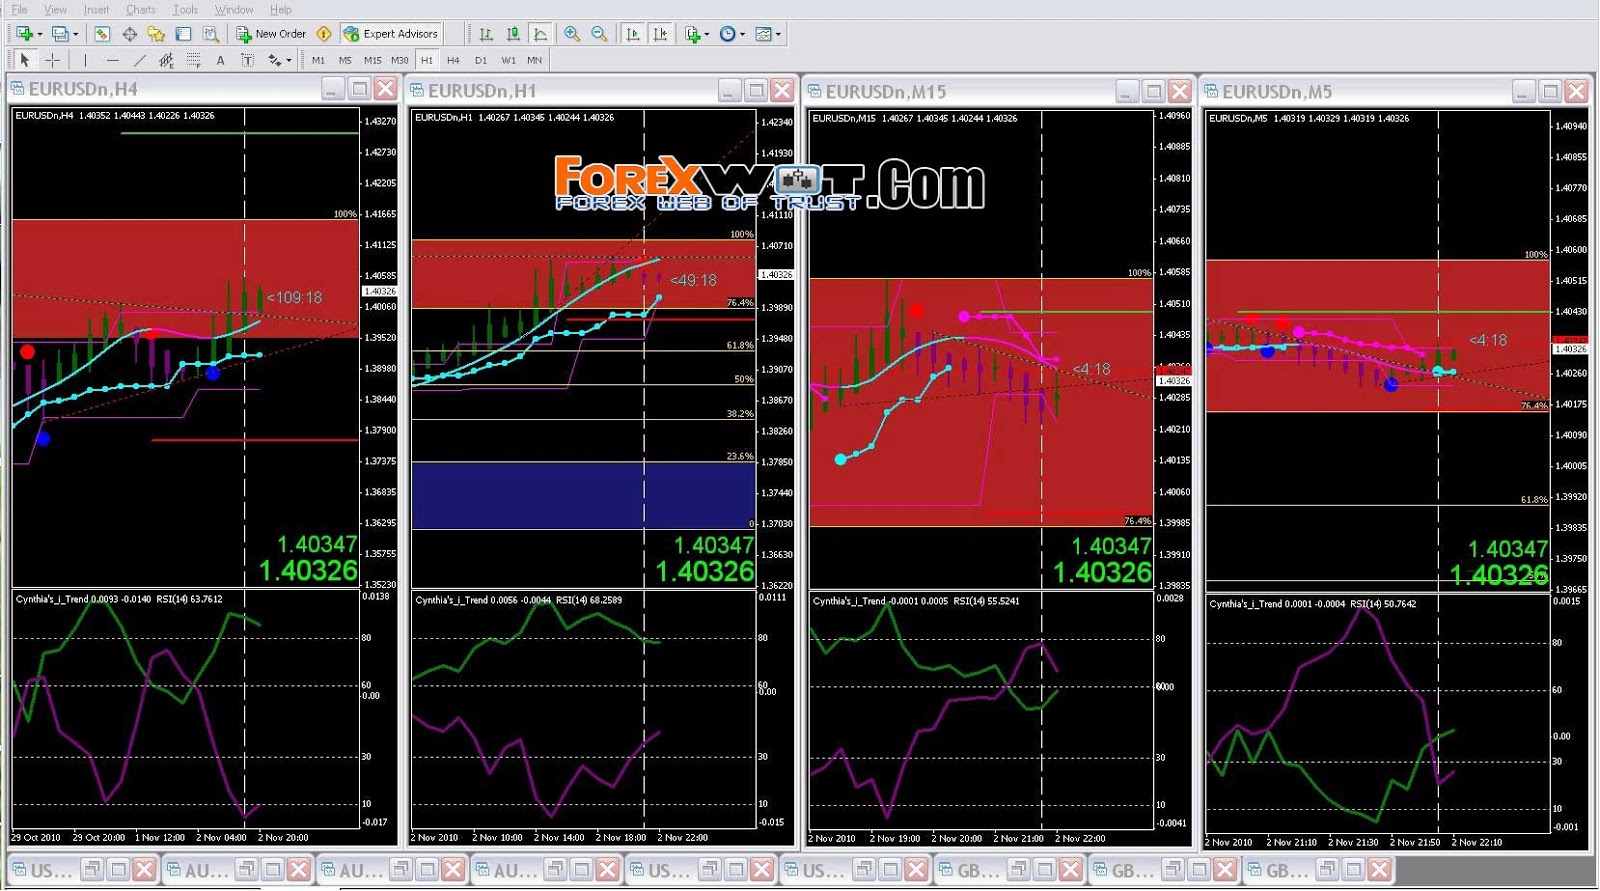
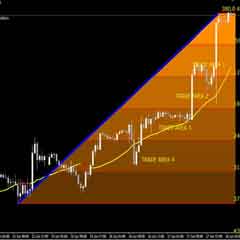
Here is a screenshot with the AutoFib Heat Map and Triangle targets. I’ve set up the charts to be 4 hr, 1 hr, 15 min and 5 min.
You can easily see that the 4 hr chart has yet to hit the fib target high of 100%, which is 1.41665…so we can predict that the price is going to continue up longterm. The triangle target is even higher, just below 1.43270.
In the 1 hr chart, the price has almost hit the 100% target.
In the 15 min chart, it had a spike that already hit the 100% target and also hit the triangle target. Resistance is the upper congestion hot pink line and the triangle target is right on it.
So we would watch for the next long trade opportunity in the 15 min chart and we know that the short term target is the 100% level in the 1hr chart and then possibly the 100% level in the 4 hr chart. [click image to enlarge]
The red zone is overbought territory so caution is advised when trading long.
The blue zone is oversold territory so caution is advised when trading short.
Trading when in a red zone means that you want to sell at the top.
Trading in a blue zone means that you want to buy at the bottom.
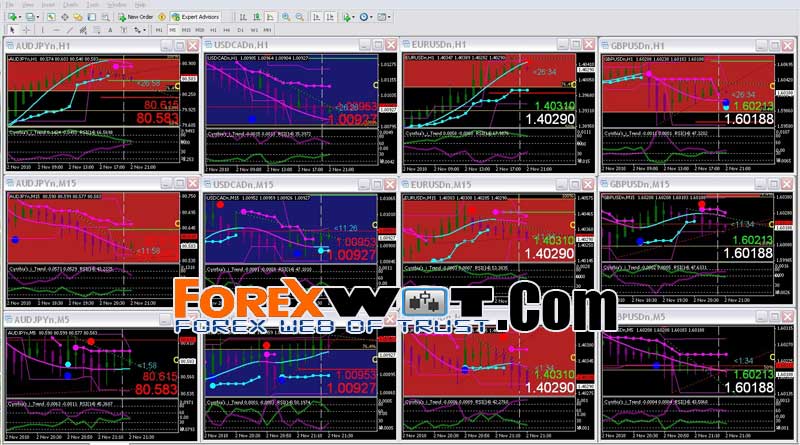
Below is a screenshot of how I set up my 4 charts so I can trade the retracements. I use a 15 min chart for best entries and exits when trading the 4 hr chart. I use a 5 min chart for best entries and exits when trading the 1 hr chart. [click image to enlarge]

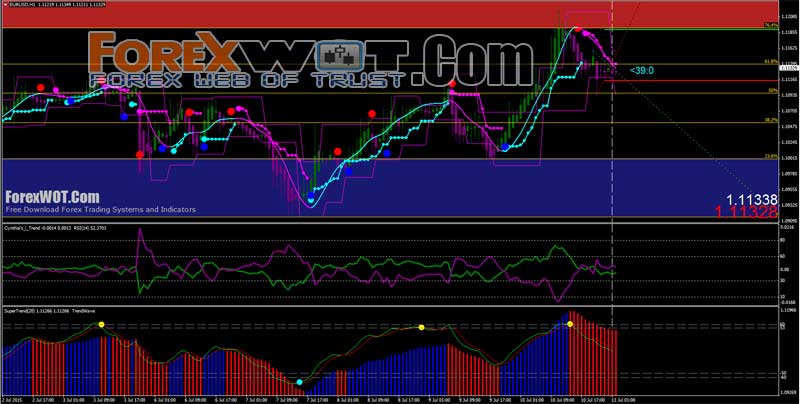
Below is a chart showing how the price blew thru the top of the triangle target and reached the 100% in all four charts. This was after a mid-day U.S. FOMC report. The 5 min chart has re-adjusted the fibo red zone to reflect the new higher price. [click image to enlarge]

This chart is the morning after the FOMC report: [click image to enlarge]

The price hit the new higher 100% target in all 4 charts and is now bouncing back down. We can see the 15 min chart doing the retracement and the best entry and exit was in the 5 min chart. The red dot has appeared in all charts except the 4 hr chart so it’s possible the price still has some upside to it.
When you see the price and indicators in the 15 min chart start to signal buy again, you can jump in long to see where the top is. The Fibo Heat Map in the 4 hr chart will be increased upwards and when the red dot finally appears, then exit all long trades.
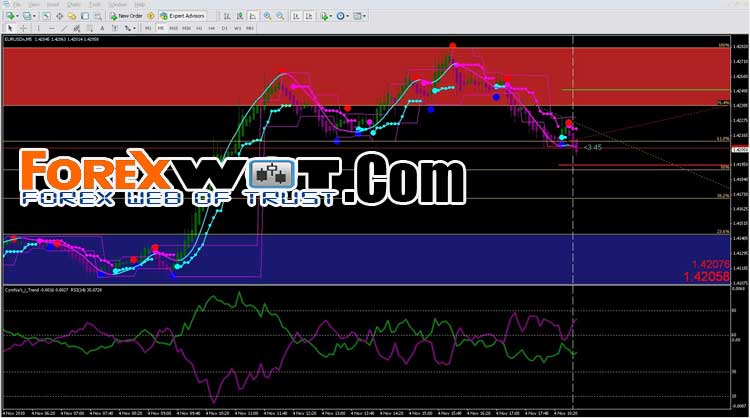
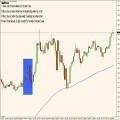
Here’s a chart where the 5 min euro has retraced and hit the 61.8% level. You could have place a pending buy order at the 61.8% price level and set it for a 20 pip take profit with a 20 pip stop loss and picked up a quick easy stress-free 20 pips. This is the predictive power of using fib levels in action! [click image to enlarge]

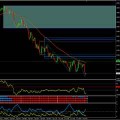
Here’s a blow up of the euro 5 min chart showing the successful 61.8% retracement and the subsequent resumption of the downtrend. At this point you could place a market sell order with your target at the triangle target of 1.41950, which is just above the 50% fib line. You could also place another pending buy order at the 50% fib line with a 20 pip TP and SL to play the retracement bounce.
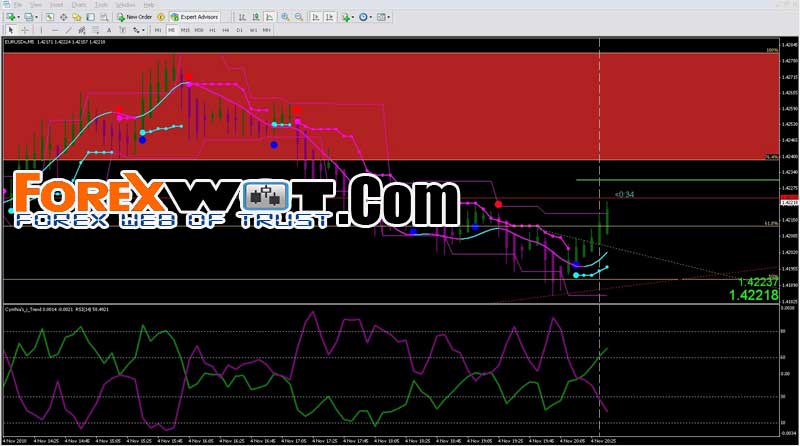
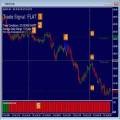
Here’s the next blowup of the euro 5 min chart showing how the price reached the 50% line and the bounce off of it back up to the 61.8% line:
If you practice this style of trading, you could do very well. For traders that have to go to a J.O.B., if you took even 1 hour each morning to trade from one fibo level to another, you would be able to retire within the year! (theoretically of course!)
We all know that trading just 20 pips a day with 1 standard lot will give you a nice income of $50,000 a year! Please practice proper money management! Grow your account slowly and safely.
[sociallocker]
[/sociallocker]
 FOREX 1 MIN Scalping Trading Tricks By The Most Successful Forex Trader
 Foreign Exchange Currency Trading & Investment Strategy – Forex Z 20 System for Successful and Highly Profitable Forex Trader
 Forex and Crypto “MORNING TRADE” Trading Strategy for Advanced Traders
 Sure Forex Breakout System Absolutely Amazing and Easy Forex Strategy
 Forex Breakout Trading Strategy with CCI and ADX
 Complete Guide To Forex Trading : Forex Long Term or Short Term Trading Strategy
 Forex Trend Trading Tricks Of The Successful Forex Trader
 RSI Momentum Secret Method Forex Trading System – Step by Step Tutorial
 2 MACD Effortless Forex & Stocks Swing Trading Strategy
 LEVELATOR Forex Trading Method – It Has About a 70% Win Ratio

hi