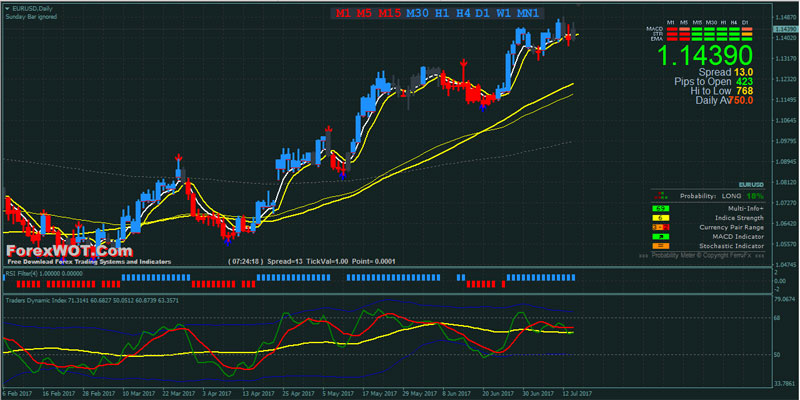
Forex and Binary Options Trading Strategy – High Probability Trading Setups and Technique with TDI and MACD Candle Indicator. The whole system is based on waiting for the reversals of the market on all time-frames that show us the second indicator “Time-Frames Analysis“. This will ensure that we trade in the direction of the long-term trend of the market, while in the short term, we have a well-timed entry into the market.

So, on the higher timeframes (H4, Daily, Weekly, Monthly) I am waiting for a clear rising or falling of the market.
Conversely, on the lower time frames (M15, M30, and H1) I enter after a reversal of candlesticks in the direction of higher time-frames. You can see an overview of several reversal candlesticks below.

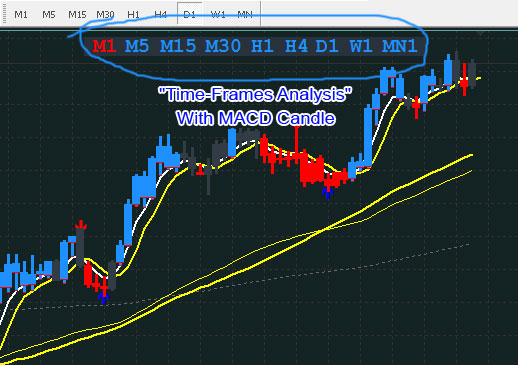
What is Time-Frames analysis? The indicator, thanks to which we have an overview of all time-frames, provides us with an overview of what is actually happening in the market.
Tracking multiple time-frames is time-consuming, yet if we follow only one time-frame, then we often lose track of the overall movement and context of the market. That’s the reason I use this indicator during my trading. “MACD Candle Indicator“.
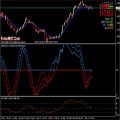
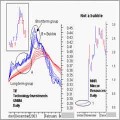
Traders Dynamic Index (TDI) MetaTrader indicator — a comprehensive but helpful indicator that uses RSI (Relative Strength Index), its moving averages, and volatility bands (based on Bollinger Bands) to offer traders a full picture of the current Forex market situation.
- RSI_Period (default = 13) — period in bars for calculation of RSI. Recommended range is between 8 and 25.
- RSI_Price (default = PRICE_CLOSE) — price type to use in RSI calculation.
- Volatility_Band (default = 34) — period in bars for volatility bands calculation. Recommended range is between 20 and 40. The lower the value the more sensitive the band.
- StdDev (default = 1.6185) — standard deviation multiplier for volatility bands. It is not recommended to change this parameter.
- RSI_Price_Line (default = 2) — period of the first moving average (fast) of RSI.
- RSI_Price_Type (default = MODE_SMA) — type of the first moving average of RSI.
- Trade_Signal_Line (default = 7) — period of the second moving average (slow) of RSI.
- Trade_Signal_Type (default = MODE_SMA) — type of the second moving average of RSI.

At a first glance, Traders Dynamic Index is not too easy to use, but you will get accustomed to it:
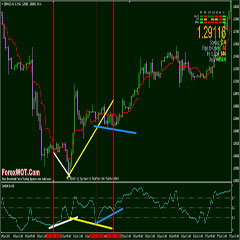
- For scalping, enter long when the green line is above the red line and enter short when the red line is the above green line.
- For short-term trading, enter long when the green is above both the red and the yellow lines; enter short when the red one is above both the green and the yellow ones.
- For medium-term trading, go long under the same conditions as for the short-term trading but only when all lines are below 50; to go short — the same but above 50.
Mind the blue volatility band as it points to the long-term trend strength and volatility when wide. Steep green line changes also signal short-term market volatility.
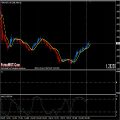
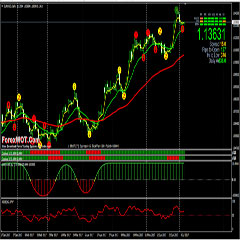
Forex Binary Options High Probability Trading Setups and Technique with TDI and MACD Candle Indicator. This Trading System is a trend-momentum system based on moving averages TDI, MACD Candle, and RSI Filter.
The General Rules of Trading System:
- Trade only in the direction of the primary trend (H4, Daily, and Weekly).
- Enter the market on the lower time frames (M15, M30, and H1) after a reversal of candlesticks in the direction of higher time-frames.
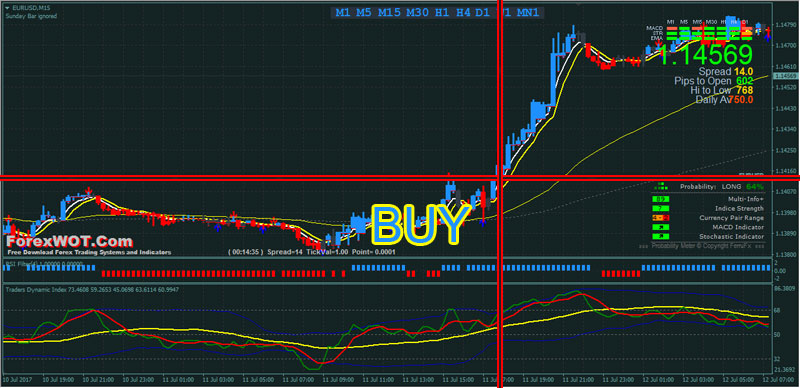
- The green line TDI Indicator is above both the red and the yellow lines and when all lines are above 50 level.
- MACD Candle blue color
- MACD Candle Time-Frames analysis
- The lower time frames (M15, M30, and H1) after a reversal of candlesticks in the direction of higher time-frames (H4, Daily, Weekly, Monthly).
- RSI Filter blue color bars
- Signal Trend green bars
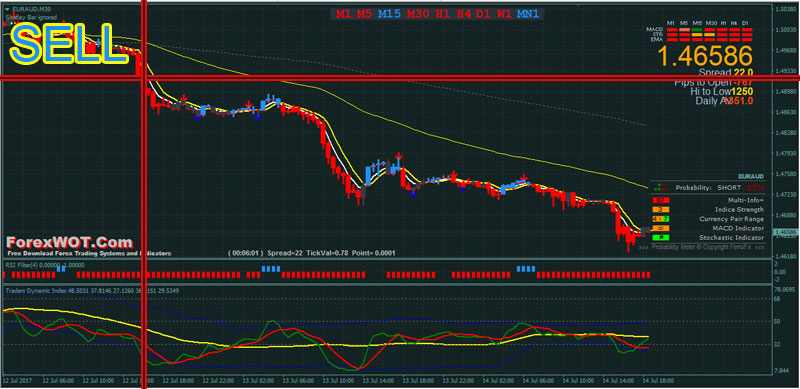
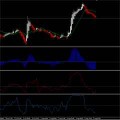
- The green line TDI Indicator is below both the red and the yellow lines and when all lines are below 50 level.
- MACD Candle red color
- MACD Candle Time-Frames analysis
- The lower time frames (M15, M30, and H1) after a reversal of candlesticks in the direction of higher time-frames (H4, Daily, Weekly, Monthly).
- RSI Filter red color bars
- Signal Trend red bars
We use major S / R levels in the market.
- If we open a BUY trade, then the Stop-Loss will be set under the first logical support nearest to the current market price, and Profit-Target will be set at the first logical nearest resistance in the market.
- If we open a SELL trade, then I will set the Stop-Loss above the first nearest resistance to the current market price, and Profit Target will be set on the first nearest logical support in the market.
[sociallocker]
[/sociallocker]
 2 MACD Effortless Forex & Stocks Swing Trading Strategy
 Premium Forex Trading Strategy – TDI Moving Average Filtered by Trendline Fast Indicator (TDI)
 MA COBRA Forex & Stocks Trading Strategy (Extremely Low Risk High Reward Trading Strategy) (COBRA SYSTEM)
 Very Profitable Forex Heiken Ashi candles TDI Stochs Trading Method (HEIKEN ASHI)
 RSI Momentum Secret Method Forex Trading System – Step by Step Tutorial
 Best Forex Trading Software – A Simple Forex Binary Holy Grail Trading System & Strategy
 FREE DOWNLOAD 20+ Best Forex MACD-Moving Average Trading System
 Stocks and Currency Trading With GUPPY Multiple Moving Averages Trading System
 Forex Binary Options Divergence and Convergence DeMarker Price Action Trading Strategy
 Forex Binary Options High Low EMA Octopus Solar Winds Joy Trading Strategy
