Trading Forex with Double LSMA (Least Square Moving Average) – The easiest and high accuracy Moving Average Trading System.

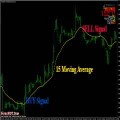
The Least Squares Moving Average is used mainly as a crossover signal to identify BULLISH or BEARISH trends.
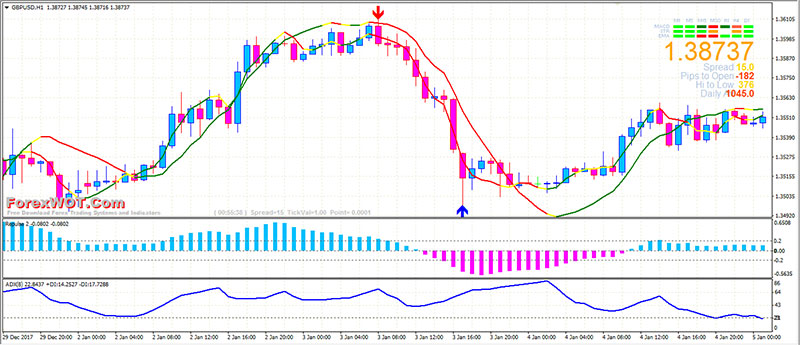
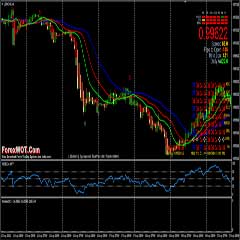
In the above chart, we have selected the one-hour chart of GBPUSD January 2-4th, 2017 and have applied the least squares moving average indicator (red, yellow, and green line).
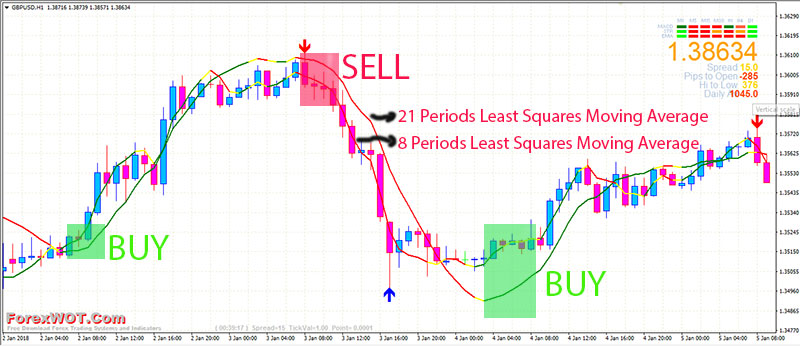
We have applied the settings of 21 periods – LSMA (21, 0) and 8 periods – LSMA (8, 0).
The Least Squares Moving Average generates signals when the price deviates from the indicator.
Now, like any other Moving Average, we need to assess when the Least Squares Moving Average is indicating a change in trend.
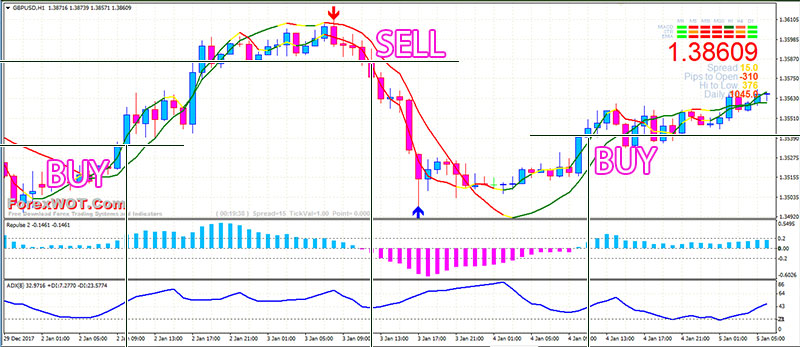
- If the signal changes to an uptrend along with recovery in prices, a BUY signal is generated.
- If the signal changes to a downtrend along with a fall in price, a SELL signal is generated.
For instance, you can see these BUY/SELL signals from the same the one-hour chart of GBPUSD highlighted in the green and red respectively.
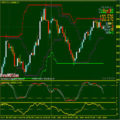
Now, let’s combine the Least Squares Moving Average with the trend momentum indicators to maximize your trading accuracy.
The Least Square Moving Averages has also known as the end point Moving Average indicator and is calculated based on the least squares regression line for the preceding time periods.
Like any other Moving Average, the Least Square Moving Average also generates a bullish or bearish trend based on crossovers of itself with two different periods. (as we have discussed above)
 How Do I Become a Good and Prifitable Forex Trader
 High Accuracy Volty Channel Stop RSI Trading Strategy and How to Win Consistently in Forex Trading
 Forex Bill Williams Market Facilitation Index (BW MFI) Multi Trend Trading System and Strategy
 Forex Breakout Trading Strategy with CCI and ADX
 High Probability Trading: The 10 Pips Forex Trading Strategy
 EASY Forex H1 IntraDay Trading System With Bill Williams Alligator Multi Trend Signal
 FREE DOWNLOAD 20+ Best Forex MACD-Moving Average Trading System
 Forex and Crypto “MORNING TRADE” Trading Strategy for Advanced Traders
 The Essence of Moving Averages: What Every Successful Forex Trader Should Know
 High Profit Simplified Donchian Channels Turtle Trading System
