How to Become A Profitable Forex Trader with Forex Double MACD Support Resistance Trading System. The Double MACD is an indicator that compares the Signal lines of 2 MACDs. This comparison can cause a much faster reaction than the normal MACD – less lag. Yet, the fast reaction is not such that it over-reacts.

This indicator, like the normal MACD, can be slightly erratic. Someone might add a couple of additional Signal lines to smooth it, for clarity.
What is the ‘Moving Average Convergence Divergence – MACD‘. Moving average convergence divergence (MACD) is a trend-following momentum indicator that shows the relationship between two moving averages of prices. The MACD is calculated by subtracting the 26-day exponential moving average (EMA) from the 12-day EMA. A nine-day EMA of the MACD, called the “signal line”, is then plotted on top of the MACD, functioning as a trigger for buy and sell signals.
There are three common methods used to interpret the MACD:
- Crossovers MACD – When the MACD falls below the signal line, it is a bearish signal, which indicates that it may be time to sell. Conversely, when the MACD rises above the signal line, the indicator gives a bullish signal, which suggests that the price of the asset is likely to experience upward momentum. Many traders wait for a confirmed cross above the signal line before entering into a position to avoid getting getting “faked out” or entering into a position too early, as shown by the first arrow.
- Divergence MACD – When the security price diverges from the MACD. It signals the end of the current trend.
- Dramatic rise MACD – When the MACD rises dramatically – that is, the shorter moving average pulls away from the longer-term moving average – it is a signal that the security is overbought and will soon return to normal levels.
Traders also watch for a move above or below the zero line because this signals the position of the short-term average relative to the long-term average. When the MACD is above zero, the short-term average is above the long-term average, which signals upward momentum. The opposite is true when the MACD is below zero. As you can see from the chart above, the zero line often acts as an area of support and resistance for the indicator.
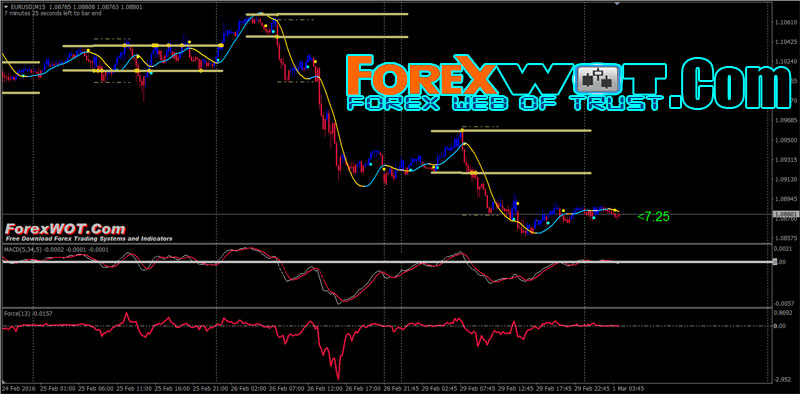
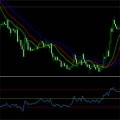
Forex Double MACD Support Resistance is a trend-following forex trading system. The Double MACD settings are 5 exponential moving average (EMA), 34 exponential moving average (EMA), and 5 signal simple moving average (SMA). And now, let’s go to the rules…
- Double MACD rises above the signal line
- Force Index rises above the signal line
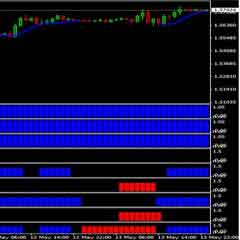
- The candles are blue color
- The candles cross above upper SDX 8 H line

- Double MACD falls below the signal line
- Force Index falls below the signal line
- The candles are red color
- The candles cross below lower SDX 8 H line

Traders looking to trade trends with Forex Double MACD Support Resistance Trading System may feel very ‘at-home’ with the indicator, as MACD is generally utilized as a mechanism to enter into trending situations. This strategy can be utilized on any timeframe longer than the hourly chart.
 2 MACD Effortless Forex & Stocks Swing Trading Strategy
 FREE DOWNLOAD 20+ Best Forex MACD-Moving Average Trading System
 MA COBRA Forex & Stocks Trading Strategy (Extremely Low Risk High Reward Trading Strategy) (COBRA SYSTEM)
 TOP10 BEST Full Time Forex Trader Trading System and Strategy
 Foreign Exchange Trading : Online Forex Master Level Trading System and Strategy
 High Profits and Super Effective FCP Forex Trading System (Forex Secret Protocol)
 Stocks and Currency Trading With GUPPY Multiple Moving Averages Trading System
 FREE DOWNLOAD Top 10+ Best Forex Trading Systems for Beginners
 Top 10 Forex ADX Trading System (High Accuracy ADX System)
 A Complete Trading System Used by Professionals to Make Millions
