Best Forex Analysis – Forex MACD Flat Market Detector Trading: The Very Easy Forex IntraDay and Swing Trading System. Traders looking to trade trends with MACD may feel very ‘at-home’ with the indicator, as MACD is generally utilized as a mechanism to enter into trending situations.

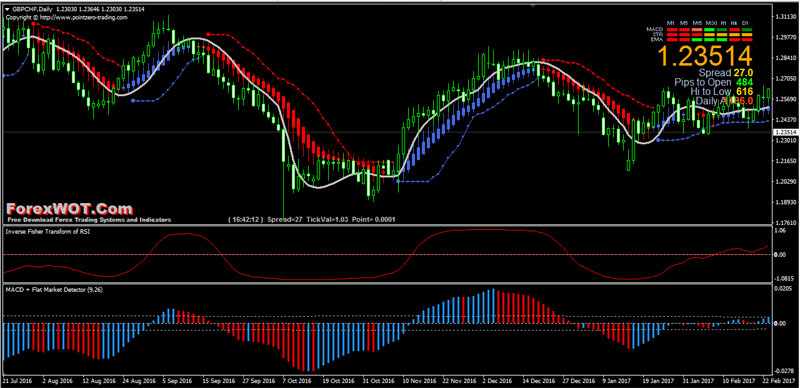
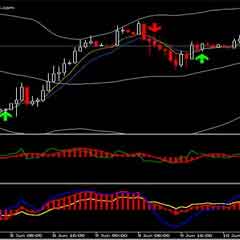
The important segment of “Forex MACD Flat Market Detector Trading” is the MACD histogram and level lines. This histogram is particularly intended to enable us to check whether the MACD Line is moving away or nearer to our Signal Line (the upper and lower flat detector lines).
- When the histogram is in a blue color and above the flat detector lines, this is interpreted as the market having bullish momentum.
- When the histogram is in a red color and below the flat detector lines, this is interpreted as the market having bearish momentum.
Once we understand all the components of Forex MACD Flat Market Detector Trading System, we can then put them to use for trading trends.
Forex MACD Flat Market Detector Trading System is based on the MACD (Moving Average Convergence Divergence) indicator as one of the most commonly used indicators in Forex trading with another trend following trading indicators.
- Best Time Frames: 30M and 1H for intraday trading, 4H and Daily for swing trading.
- Recommended Currency Pairs: GBPUSD, EURUSD, …all major pairs
- MACD Flat Market Detector
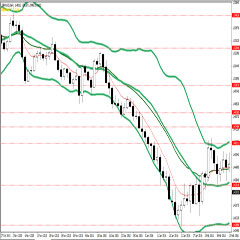
- Bollinger bands stop (15; 1)
- Heiken Ashi Smoothed alert
- Inverse Fisher Transform of RSI indicator (9, 20)
- Jurich Filter Indicator (15)
- Signal Trend
Only enter the trade with all indicators confirmation for a perfect signal
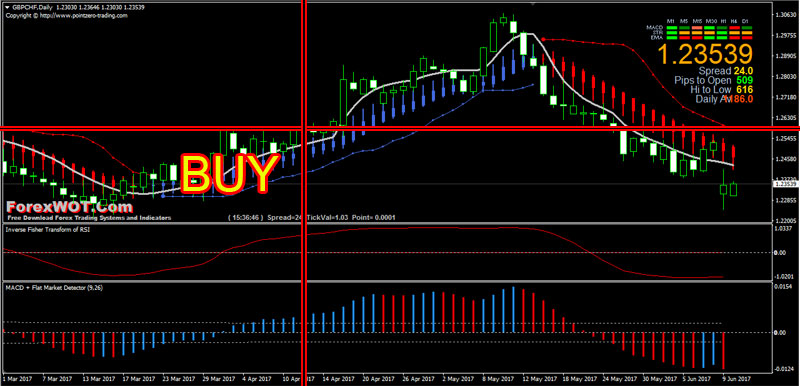
- The histogram is in a blue color and above the flat detector lines
- Bollinger Bands dots turns into blue color
- Heiken Ashi Smoothed alert candles turn into blue
- Inverse Fisher Transform of RSI indicator goes above 0 level
- The price above Jurich filter line
- Signal Tren green color bars
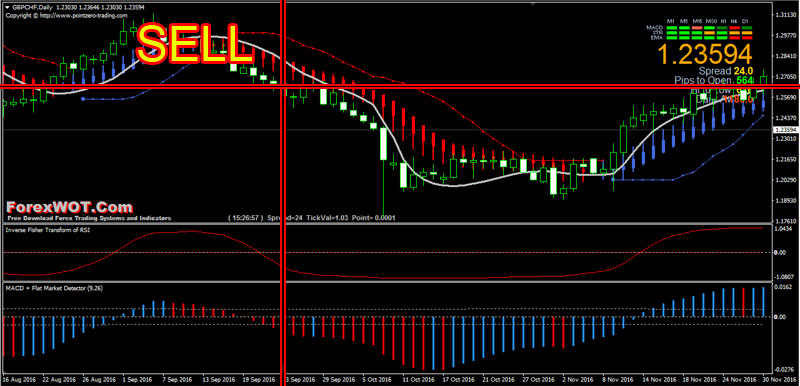
- The histogram is in a red color and above the flat detector lines
- Bollinger Bands dots turns into red color
- Heiken Ashi Smoothed alert candles turn into red color
- Inverse Fisher Transform of RSI indicator goes below 0 level
- The price below Jurich filter line
- Signal Trend red color bars
- You should put stop loss on previous candle high or low (above or below Bollinger Bands dot of previous candle).
- Also trailing stop could be applied above or below Bollinger Bands dot of previous candle
- Profit Target 3x or 2x Stop Loss
[sociallocker]
[/sociallocker]
 TOP 10 Best Bollinger Bands Forex Trading System and Strategy
 2 MACD Effortless Forex & Stocks Swing Trading Strategy
 FREE DOWNLOAD Top 10 Forex Currency Trading Systems With Bollinger Bands Indicator
 FREE DOWNLOAD 20+ Best Forex MACD-Moving Average Trading System
 Forex Forbi EMA-Bollinger Moderate Swing and Trend Trading Strategy
 Best Top 10 Most Popular Moving Average Trading Strategy You Should Know
 Top 10 Forex ADX Trading System (High Accuracy ADX System)
 Top 10 Strategy to Build on Your Winning Forex Open Positions
 10 Very Easy and Accurate FOREX MACD Trading System
 TOP10 BEST Full Time Forex Trader Trading System and Strategy
