High accuracy Forex MagicBreakout with EMA (Exponential Moving Average) and CCI indicator to maximize your profits and achieve exponential earnings.


What makes the MagicBreakout strategy different and magic..?
If you strictly follow the money management rules, it is a very easy task to become a Forex millionaire in a relatively short time.
Can’t believe? Let us show you…
Enter the market before the crowd.
With this strategy, you will be able to predict breakouts before the momentum traders arrive.
- MagicBreakout is a CONSERVATIVE trading strategy
- It’s safe. You risk a small amount of money on every trade.
- Mechanical
- Trade by following a set of simple rules.
- Easy to implement
- Convince yourself that trading is really easy!
- Profitable
- If you stick to the rules and go through a series of losing trades, you will finally become profitable.
- Scalable
- Our MagicBreakout strategy has become a key of the top traders.
- An improved MagicBreakout+ strategy can make +67% in one month.
- Our student made 5400% in one year using his own exit rules.
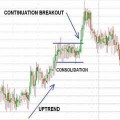
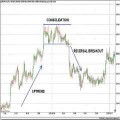
A breakout happens when the price breaks a SIGNIFICANT HIGH and makes a NEW HIGH. Another breakout happens when the price breaks a SIGNIFICANT LOW and makes a NEW LOW.
This is the definition. Let’s give an example.
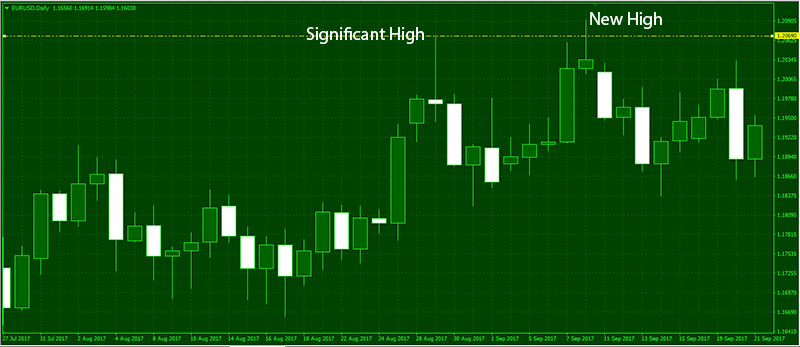
It looks simple.
Most professional traders are trying to catch these breakouts and make money on the accelerated price move.
A so-called momentum trader places his Buy-Stop order just above the significant high.
He is waiting for this HIGH BREAKOUT… If there is no breakout, he cancels his Buy-Stop order and prepares for the next trade.
If the breakout happens and his buy-stop target is filled, his trading platform automatically opens a long position.
The same holds for a LOW BREAKOUT (in that case, the trader would place a sell-stop order).
Why are traders doing that?…
Because the price action typically accelerates after a breakout and results in a nice profit. But it’s not so sweet every time.
There is a risk of significant loss.
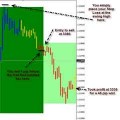
The nightmares of momentum traders are “FALSE BREAKOUTS” and they happen too often. Let’s explain why.

Let’s discuss the false high-breakouts (the same holds for low-breakouts).
There are times when price breaks a significant high, a buy order is filled, a long position is opened, but the price quickly turns back down and never comes up or Stop Loss is filled.
The trader has to exit the position with a loss.
Small losses are not something unusual.
Every professional trader has LOSSES in Forex trading, you have to admit it.
But a profitable trader wins more than loses after time.
We have tested some breakout systems on all major currency pairs ten years back.
Most of the breakouts were false breakouts or resulted in a small profit.
Any system that relies purely on breakouts does not work consistently.
Since we, Tim and Julie, are in the financial markets for more than ten years, we have collected some sort of information the large banks and corporations do not want you to know.
A large bank has enough money to move the market for a while.
When the price hits the significant high again, it should normally bounce back from this high forming a double top pattern.
But momentum traders would go long when a breakout happens – it is the well-known practice explained in the previous paragraph.
When the price comes close enough to the high, traders inside the bank quickly buy a large volume of one currency pair ($ millions!).
They move the market a few pips up and a forced breakout happens! There is a bunch of buy-orders lying just above the high and these orders get filled immediately.
Then the market moves some additional pips up because of the new long positions.
After that, the bank happily closes its own large position (sells the millions back) and the price quickly turns back. The banks “earn” great amount of money doing this unfair business.
They do it a few times every day…
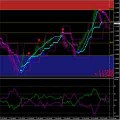
Julie experimented with the CCI indicator (Commodity Channel Index) in the Forex market years ago.
There are two common lines: +100 line and -100 line on the indicator chart.
- When CCI crosses (or “breaks”) the 100 line upward, it is a good entry signal to go long (BUY).
- When CCI crosses (or “breaks”) the -100 line downward, it is a good entry signal to go short (SELL).
Good signal means that the probability of winning dramatically increases. In other words – CCI indicator acts like a filter for spotting winning trades.
Not only a filter…!!!
It gives an opportunity to enter the market before a breakout!
There was a hard work in developing a definite profitable strategy based on this knowledge.
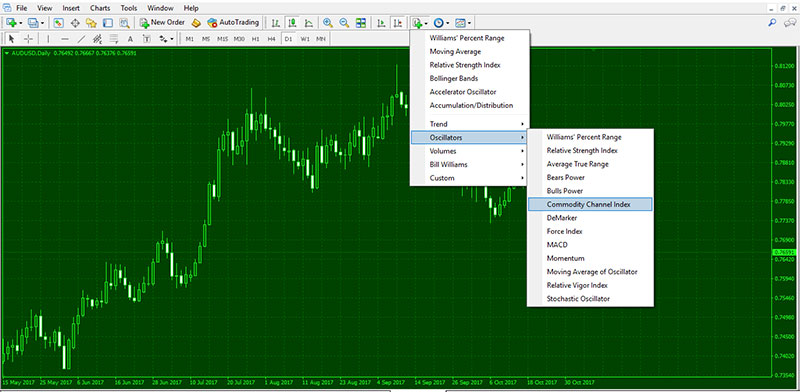
For the entry rules, we need two basic indicators:
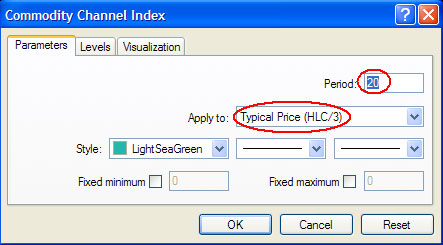
- CCI 20 (Commodity Channel Index, Period 20, Typical Price)
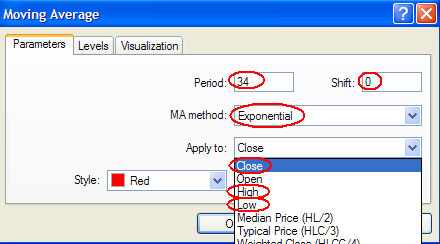
- The Wave (EMA34 High, EMA34 Close, EMA34 Low)
The second one actually consists of three Exponential Moving Averages, but we will treat them as one indicator called the Wave.
We will call the Moving Averages Wave-top, Wave-middle, and Wave-bottom.
The set-up for MetaTrader 4:

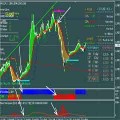
Our chart is prepared for trading the basic MagicBreakout strategy
First, we will discuss long entries. Now, read the rules and you will learn practical implementation step by step in the next paragraph.
- Be sure that the market is trending up.
Beware from the sideways market. A WAVE is a great tool that helps us to determine the trend.
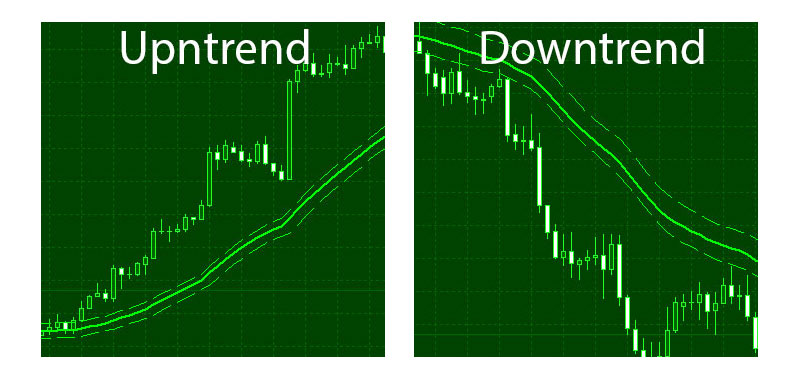
Trend definition:
Uptrend: The price has already crossed the Wave upward and the price is above the Wave bottom at this moment.
Downtrend: Similarly, the market is trending down if the price is below the Wave-top.
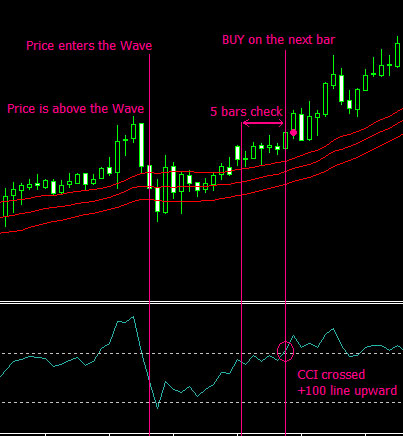
- Price was above the Wave for some time.
(above the Wave-top) - Price entered the Wave.
Price was above the Wave and then crossed the Wave-top downward. - CCI crossed +100 line upward; A POSSIBLE LONG ENTRY SIGNAL on the next candlestick opening.
This is a good signal to go long on the next candlestick opening. But be careful… - “Five bars check” rule.
Check that CCI was below the +100 line for at least five bars before the cross. - Check that the market is trending up now.
Check that the price is above the Wave-bottom as in the first rule. - Buy now!
If all above has fulfilled, buy as the new candlestick opens.
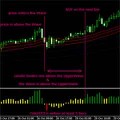
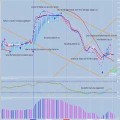
Look at the picture. We have defined an interesting pattern called the “swing”.
Simply said, price entered the Wave and then returned back up.
But this sentence sounds too subjective.
We have put it all into mechanical rules that are easy to follow.
Don’t enter the market when you “FEEL” that the price is going up again.
Some traders do so, but they get stuck when the price plunges lower! Don’t rely on the standard breakout system.
The breakout may be false.
Enter only if CCI has crossed the line! Look at the picture carefully.
Do you see that we have entered the market before the breakout… before the crowd?!
Do you see the great advantage of the MagicBreakout strategy?…
Practically, you must follow the written rules backward:
- CCI crossed the +100 line upward.
Was it below the +100 line for at least five bars? Is it above the +100 line now? If yes, continue to the next step.
Remember, the signal is valid only if the candlestick has already closed. - Is price trending up?
Is price above the Wave-bottom? (Stick with our definition! Don’t let your feeling or intuition to define the trend! Trend definition is a mechanical task here, although sometimes counterintuitive.) If yes, go to the next step. - Do you see a valid swing pattern?
Train your eyes on the first few trades and you will see the swing pattern subconsciously without reviewing the rules. Review: price was above the Wave and then entered the Wave. In other words, price crossed the Wave-top downward. OK? - BUY now…!
And prepare your exit targets…
We can simply create the rules for a short entry:
- CCI crossed the -100 line downward.
Look at CCI when the candlestick has closed. Was it above the -100 line for at least five bars?
Is it below the -100 line now? If yes, continue to the next step. We have to check market conditions. - Is price trending down?
Is price below the Wave-top? (Stick with our definition! Don’t let your feeling or intuition to define the trend! Trend definition is a mechanical task here, although sometimes counterintuitive.) If yes, go to the next step. - Do you see a valid swing pattern?
Train your eyes on the first few trades and you will see the swing pattern subconsciously without reviewing the rules. Review: price was below the Wave and then entered the Wave. In other words, price crossed the Wave-bottom upward. OK? - SELL now…!
And prepare your exit targets…
Note:
There exists a better entry and much better way how to identify the trend and filter some bad trades by looking only once on another time-frame.
Such a system is a great advantage because there are only a few traders watching on two different time-frames.
You will learn our “Holy Grail” in the next chapters of the incredible MagicBreakout+ strategy with our proprietary indicators and alerts that will make you a top trader.
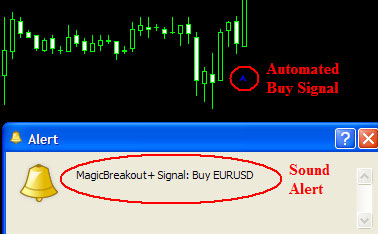
We are too lazy to watch the market and look for good entry signals.
The MagicBreakout+ indicators and alerts help us to do it AUTOMATICALLY. You will never miss a good signal or break the rules, the software can check all the rules for you.
The software tells you exactly where to place Stop Loss! We recommend it for beginners too. The indicators will help you fully understand the swing formation and our amazing system.
We will use Fibonacci targets in this version.
Fibonacci targets are very powerful.
We often see that price hits the target and quickly retraces back. MetaTrader 4 set-up:
Click on the tool Fibonacci Retracement:
![]()
Place the Fibonacci retracements on the chart as shown below. Connect the swing high with swing low by dragging the mouse.
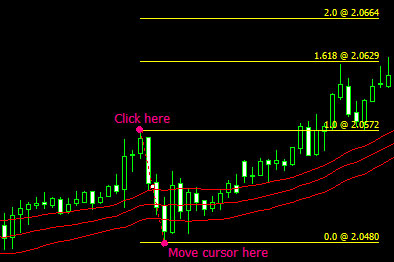
You have to modify the default set-up. We will use these targets: 0.0, 1.0, 1.618 and 2.0. Right-click on the chart and choose Objects List (or use shortcut CTRL+B).
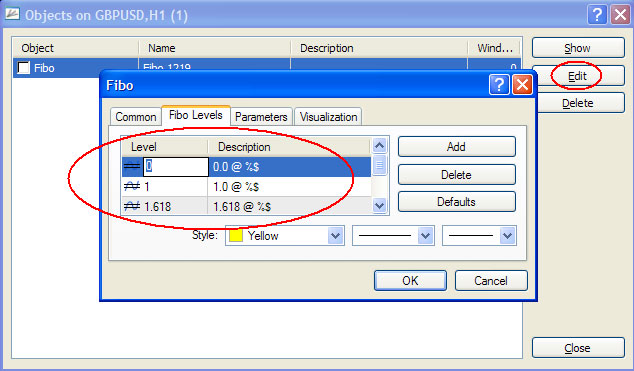
Select Fibo and click Edit. Edit the targets by double-clicking on the Level and Description values.
We will use these Level values: 0, 1, 1.618 and 2. You can choose a custom description for each level value.
We recommend setting something like 0.0 @ %$ as a description.
It is a useful trick; the mysterious symbol %$ will be replaced by the price level on the chart (example: 0.0 @ 2.0480).
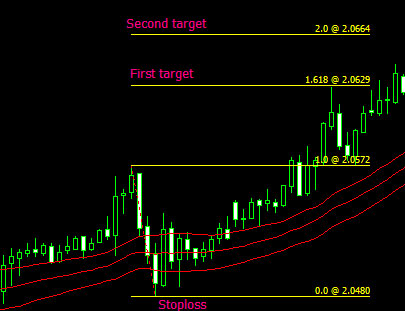
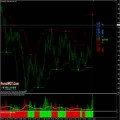
Plan your trade, trade your plan. Let’s assume we have opened a long position. We must take care about the profit target and Stop Loss right after the entry.
- Place the first profit target (sell-limit order) at 1.618 Fibonacci level;
- Place the second profit target (sell-limit order) at 2.0 Fibonacci level;
- Place Stop-Loss (sell-stop order) at 0.0 Fibonacci level.
s the price hits our first target, close a half of the position (so we recommend you to trade at least two lots/mini lots/micro lots).
As the price hits our second target, sell the rest.
Place Stop Loss just two pips below the 0.0 level.
The low acts as a support and if broken, the trend is probably over.
We can simply create rules to exit from a short position:
- Place the first profit target (buy-limit order) at 1.618 Fibonacci level;
- Place the second profit target (buy-limit order) at 2.0 Fibonacci level;
- Place Stop-Loss (buy-stop order) at 0.0 Fibonacci level.
Note:
This is a basic EXIT Rules.
You can consistently make money using entries and exits as described above.
But look at the chart: wouldn’t it better if we exited later? The trend continues and we are not in!
Wouldn’t it better if we could squeeze the trend to the end and earn HUGE profit from one single trade…? “Trend following” from the beginning to the end of the trend is a dream of all traders in the world.
Some individual traders know how to achieve it.
They know how to recognize that the trend is probably going to reverse.
They stay with the trend for days, weeks or even months and make millions.
 Forex Magic Breakout – Using the CCI Indicator to Find and Filter Trades
 Forex Elliott Wave Strategy – Using the Elliot Wave Oscillator (EWO) to Predict Forex Moves
 Learn Forex Online – WOLFE WAVE Trend Advanced Forex Trading System
 Currency Forex Online Trading – Winning Breakout Trading Strategy
 Forex Trand Wave System Highly Effective Market Trends Analysis
 Forex Advanced Breakout Trend Easy and Simple System for Trading Success
 Forex and Crypto “MORNING TRADE” Trading Strategy for Advanced Traders
 MACD RSI Trading – The Easiest Way To Measure Forex Reversal Breakouts
 Forex Trend Trading Tricks Of The Successful Forex Trader
 Easy Forex Profits Guard – How to Profit with Forex Trading
