This easy strategy based on two indicators: RSX and Pivots. I love both very much. Actually i am not a developer of this one, i just had realize: This system perfect fits my style of trading.


This strategy is based on Pivots + RSX + Stochastic on M15 & M30 – Intraday rangebound. Phanti is a real good trader in my opinion and i learned a lot from him…Keep it up Bro
Id like his origin idea very much, before he switched to trading with supply and demand areas. S/D areas are very powerful in forex and trading with that ones could be very successful, but i wanna make something different.
So i am gonna trade in m15 Timeframe . I am not a patient one, so trading in higher timeframes is a lil bit torture for me I now the pros would say now: “If you don’t have any patience u wont earn any cash in this business in the long run…” But seriously, i cant wait for 4 or 24 hours to candle close…
Maybe i can be very successful with that one and reach my personal target: Make trading for a living or i will completely fail and burn my account in a few days, who know.
So lets go to the facts, we need two constellations:
- RSX in oversold/overbought area
- Pair bounced of the Pivot
- Wait for candle close
- R:R ratio of 1:2
- Please follow your moneymanagement
- Don`t trade on News-Events
- Please set a stoploss
“…There’s many ways to make money in this business & we all have our preferred methods. If what you do works for you, great! Keep doing it but also keep learning.”
- RSX: Len 14, Overbought Area > 80/ Oversold Area < 20
- Pivots: Using Daily, Weekly and Monthly Pivots
Thats it, very easy. I like the simplicity of it, almost a naked chart.
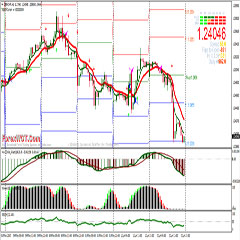
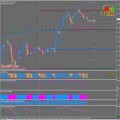
Small example from today:
GBP/USD pair bounced nicely from Weekly S1 with a hammer, RSX is oversold. Both conditions are true, you entered a trade after the hammer. Set your SL 20 Pips, your TP is 40 Pips, i set also a trailingstop on 20 Pips in this strategy.

You can trade trend after the S1 or R1 breaks the price will go to S/R3 at maximum. Sometimes it will breach S/R3, but 90% of the time it will return to lvl3 very soon.
A set of indicators developed by floor traders in the commodities markets to determine potential turning points, also known as “pivots“. Forex pivot points are calculated to determine levels in which the sentiment of the market could change from “bullish” to “bearish.” Currency traders see pivot points as markers of support and resistance.
Forex pivot points are calculated as the average of the high, low and close from the previous trading session: Forex Pivot Point = (High + Low + Close) / 3
Because pivot points are thought to work well in very liquid markets, the spot forex market may be the perfect place to use them.
Day traders use the calculated pivot points to determine levels of entry, stops and profit taking by trying to determine where the majority of other traders may be doing the same.
Forex pivot point calculators are available free of charge across the internet through retail forex brokers and third-party websites.
The main Pivot Level is the most important level [( Yesterday High + Yesterday Close + Yesterday Low )/3] . In a trading day, if price opens under this level, it means it has a stronger tendency to go down and Bears are stronger. So we can take a short (sell) position. If the price opens above the Pivot Level, it means Bulls are stronger and we can take a long (buy) position. All other levels may work as support and resistance and so we have to be careful when price reaches them.
For me, the Pivot Levels will be considered as the potential support/resistance levels, and I will not take any position just because the price is opened below or above the main Pivot Level.
I use my technical analysis, find patterns and pennants and will have an eye on the Pivot Levels to close my trades on time before I lose my profit. I consider this rule that if price is opened above the main Pivot Level, it may go up and visa versa. Then I wait for a breakout and will take the proper position.
For example, I would consider that price was opened above the Pivot Level and it had a stronger tendency to go up. Then I would wait for the price to break above the wedge and then I would go long. Then I would have an eye on it and as soon as it showed some reactions to the R1 level, I would fix my profit. So Pivot Points are just some help. They don’t generate buy/sell signals.
 How Do I Become a Good and Prifitable Forex Trader
 Foreign Exchange Currency Trading & Investment Strategy – Forex Z 20 System for Successful and Highly Profitable Forex Trader
 Best H1 Forex Pivot Points Levels Trading Strategy Based on MACD, AFL Winner, RSI, and EMA indicator
 High Accuracy Volty Channel Stop RSI Trading Strategy and How to Win Consistently in Forex Trading
 Forex M30 H1 Time Frame Trading: High Accuracy Pivot All Levels Trading With Daily Weekly Open Trading System
 Best Forex & Stocks Trading Strategy with Dolly-Graphics System
 Forex Bill Williams Market Facilitation Index (BW MFI) Multi Trend Trading System and Strategy
 Forex and Crypto “MORNING TRADE” Trading Strategy for Advanced Traders
 Trend Following Forex Trading System Based on Non-Lag Trending Indicators
 High Probability Trading: The 10 Pips Forex Trading Strategy
