Forex Multiple Moving Averages Trading Strategy. This concept can be used to identify support and resistance levels to help you increase profits and reduce risks.

Always remember that the closing price causes a crossover: that is when a signal is generated.

There are two terms technicians use to identify trend changes:
- Dead Cross – bearish or negative cross-over of a shorter term M/A than a longer term M/A.
- Golden Cross – Bullish or positive cross-over of a shorter term M/A than a longer term M/A.
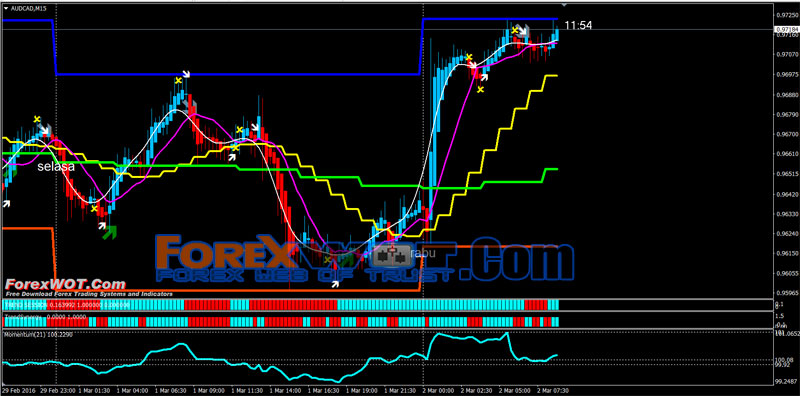
In figure 1 below we have a 15-minute chart with a trading system, I designed based on the aid of proprietary moving average settings combined with specific algorithms which give me indications of price changes.
Also, I have combined the use of Pivot Point support and resistance levels to aid me in identifying what makes the markets move, these two considerations are time and price.
As you can see, simply put, when the blue line crosses below the yellow line a double triangle forms giving me an indication of a dead cross, or SELL signal. When the opposition occurs we have a golden cross concept.
During periods of sideways action moving average systems have a weak link in that they generate false BUY and SELL signals.
Therefore we need to add some filters to help us in determining which signals to take or fade.

Figure 1
Stochastics a range based oscillator it is also considered a momentum oscillator George C. Lane is credited with creating the formula.
I had the privilege of working with George back in 1980 through 1982.
This indicator is a popular technical tool used to help determine whether a market is overbought, meaning prices have advanced too far too soon and due for a downside correction, or oversold, meaning prices have declined too far too soon and due for an upside correction.
It is based on a mathematical formula that is computed to compare the settlement price of a specific time period to the price range of a specific number of past periods.
Most Recommended Moving Averages Trading System
- High Profitable Moving Average MACD Forex Strategies
- Most Accurate Moving Average TrendLine Trading System
- Forex Multiple Moving Average: Discover How to Make 600 Pips a Month Consistently
- Advanced Moving Average Forex Trading System and Strategy
The theory works off the assumption that in a bull or up-trending markets, prices tend to make higher highs and the settlement price usually tends to be in the upper end of that time periods trading range.
When the momentum starts to slow the settlement prices will start to fade from the upper boundaries of the range and the Stochastics Indicator will show that the bullish momentum is starting to change.
The exact opposite is true for Bear or down trending markets.
There are two lines that are referred to as %K and %D.
These are plotted on a horizontal axis for a given time period and the vertical axis is plotted on a scale from 0% to 100%.
The formula to calculate the first component, %K: (14 periods)
The value of %K =c-Ln/Hn-Ln*100
c=closing price of the current period, Ln= lowest low during n period of time, Hn=highest high during
n period of time and n=number of periods.
The second calculation is the %D (3 periods)
It is the moving average of %K.
It is calculated by %D=100(Hn/Ln)
HN= the period sum of (c-Ln).
What is important is understanding the rules of how to interpret BUY or SELL signals.
When the readings are above 70%, and %k crosses over the %D line and both lines are pointing down, a “hook” SELL signal is generated.
The exact opposite is true to generate a buy signal when %K crosses above %D when the reading is below 30% and both lines are both pointing up.
There are other techniques associated when using Stochastics.
There is Fast Stochastics and Slow Stochastics.
The difference is how the parameters are set to measure the change in price.
This is referred to as a gauge insensitivity.
A higher rate of sensitivity will require the number of periods in the calculation to be decreased.
This is what “fast” Stochastics does. It enables one to generate faster and a higher frequency of trading signals in a short time period.
One other method to use the stochastic indicator is trading off of pattern’s called BULLISH convergence. It is used in identifying market bottoms.
This is where the market price itself makes a lower low from a previous low but the underlying stochastic pattern makes a higher low.
This indicates that the low is a “false bottom” and can resort to a turn around for a price reversal.
We see a great example of when we combine moving average values, pivot point support and resistance levels, candle charts and indicators how we can identify trade signals and filter out false sell signals with some simple rules.
Two rules of thumb I teach traders to look for buy signals at support and sell signals at resistance.
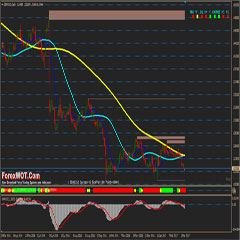
Figure 2 below shows a bullish convergence in the Stochastics as prices made a lower low, but the indicator made a corresponding higher low.
The horizontal green line was the pre-determined pivot point support and we had the green triangles give buy signals.

Figure 2
Another signal is a trading pattern called bearish divergence. It is used in identifying market tops.
This is where the market price itself makes a higher high from a previous high but the underlying stochastic pattern makes a lower high.
This indicates that the second high is a “weak” high and can resort to a turn around for a lower price reversal.
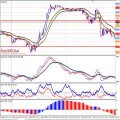
As you can see in Figure 3 below once again using multiple indicators to help filter out trade signals generated by moving average crossovers as is the case with this dead cross signal an orange triangle generated a sell signal with a corresponding bearish divergence stochastics pattern.

Figure 3
Moving Average Convergence/Divergence otherwise known as MACD in simplest terms is an indicator that shows when a short-term moving average crosses over a longer-term moving average.
Gerald Appel developed this indicator as we know it today and it is my understanding that he developed it for the purpose of stock trading.
It is composed of using three exponential moving averages.
The initial inputs for the calculations were a 9 period, a 12 period and a 26 period. I might add that since traders are now more computer savvy than ever before it is easy to change or “tweak” the variables in his original calculations.
Traders can increase the time periods in the moving average calculations to generate fewer trade signals and shorten the time periods to generate more trade signals.
This technique and concept apply to the use of moving averages as covered previously.
The concept is this, there are two lines one is the 9-period exponential averages (slow line) and the other is the difference between the 12 and 26-period exponential moving average (fast line).
This is important information because you do not want to use moving similar time settings overlaid on your charts as this would not be a confirming tool but a duplicate signal generating component.
MACD signals react quickly to changes in the market that is why a lot of analysts including myself use it.
It helps clear the picture when moving average crossovers occur.
It measures the relative strength of where current prices are as compared to past time frames from a short-term perspective to a longer-term perspective.
MACD signals are generated after the market has moved in an opposite direction of the original trend, and therefore is why it is considered a lagging indicator.
Some general points to help you understand how to use this indicator are first; when the fast line crosses above the slow line a buy signal is generated.
The opposite is true for sell signals. MACD also has a zero baseline. If MACD line is above the zero line prices are usually trending higher. The opposite is true if MACD is declining below the zero line.
Another method, and more reliable, however, one that does not form often is a pattern called bullish convergence.
This is where the market price itself makes a lower low from a previous low but the underlying MACD pattern makes a higher low.
This indicates that the low is weak or “false” bottom and can resort to a turn around for a price reversal.
MACD has the same principles as far as a sell signal with what is known as Bearish Divergence.
This is where the market price itself makes a higher high from a previous high but the underlying MACD crossover lines make a lower high.
This indicates that the second high is a “weak” high and can resort to a turn around for a lower price reversal. We see more divergence patterns in the histogram component than we do in the actual moving average MACD lines.
The chart in Figure 4 below is a daily chart on the 30 Year Treasury Bonds with the MACD indicator in the lower panel beneath the price bars.
I used a blue vertical line to help illustrate when the MACD lines corresponded with the indicator triangles and moving average crossovers.
As you can see we have situations where the histogram component forms bullish and bearish divergence when it does not appear in the MACD moving average lines.

Figure 4
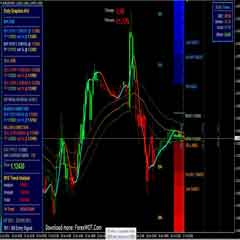
The next chart in figure 5 below has the MACD in the middle pane and the CCI indicator at the bottom.
Looking at the corresponding moving average crossovers we can see where the two other indicators line up confirming a market turn.
This shows the benefits of using the two indicators as one can generate a cleaner signal and in this case, the moving average crossover feature of the MACD confirms the sell signal.
Figure 5
Technical studies such as we discussed using Moving Averages with the aid of filters (confirming indicators) are just a part of helping to make a trading decision.
Trading requires the use of RISK MANAGEMENT, patience or the “WAITING GAME” as I call it.
Trading also involves additional training on the skills needed to know when to exit or add on to positions.
I encourage you to further your education in trading skills as well as in how to use technical analysis.
This study guide is designed to illustrate how traders can use various conditions such as the pivot point, the high, the low and the traditional close value for constructing a moving average.
This guide also brings to you the concept that one should use non-correlated confirming tools to substantiate a trade signal.
I have included a section with common questions along with answers that others have asked and perhaps this will help you as well.
FREE DOWNLOAD Top 10 Super High Profits Moving Average Forex Trading System
 How Do I Become a Good and Prifitable Forex Trader
 2 MACD Effortless Forex & Stocks Swing Trading Strategy
 FREE DOWNLOAD 20+ Best Forex MACD-Moving Average Trading System
 High Accuracy Volty Channel Stop RSI Trading Strategy and How to Win Consistently in Forex Trading
 10 Very Easy and Accurate FOREX MACD Trading System
 Forex Bill Williams Market Facilitation Index (BW MFI) Multi Trend Trading System and Strategy
 High Probability Trading: The 10 Pips Forex Trading Strategy
 Learn Forex Trading Online – FGM MACD Profitable Forex Currency Trend Following Trading Strategy
 Forex Multi MACD Ichimoku Trend Trading Strategy with Moving Average and ADX Indicator (ADX)
 Best Forex & Stocks Trading Strategy with Dolly-Graphics System
