Regardless of whether you are an experienced or a beginner trader, you can use this system. FPM is a one of a kind system which is very easy to understand and achieve a very high success rate with. If you’re looking for the best Forex system, you’re definitely in the right place because FPM, in my opinion, is the best solution.


My system is user-friendly, practical and simple. There are only TWO types of entry rules – the buy and sell entry. There are instances where you may want to be conservative on both of these entries, so I have included that in this manual.
The system works on all time frames from the 1 Minute (M1) to Daily (D1). Unlike other systems, you will have the power to choose your preferred timeframe which you think works best for you.
I recommend for beginners to use the 1 Hour (H1) timeframe during volatile sessions and the 15 Minute (M15) timeframe during quieter sessions. This system is profitable for different types of trading strategies. You can be a scalper, a day trader or a swing trader when using the system – you can decide!
A great advantage of the Forex Profit Matrix system is that it works on all timeframes. The choice of timeframe depends on your own personal preference.
However, I would suggest that while you are still new to the system, you use the 1 hour (H1) timeframe during volatile sessions like the London/NY session and, as you gain more experience, the 15 minute (M15) timeframe during quieter sessions like the Asian session.
When describing the rules below, I will be using the 15 minute (M15) timeframe. The rules apply to all timeframes and you are welcome to use any other timeframes you prefer to trade.
- Wait for the Trend Booster indicator to turn Blue in color.
- Wait for the Heiken Matrix bars to turn Blue in color.
- As soon as the 2nd Blue Heiken Matrix bar closes, place a Buy trade order at the open of the new candle.

- As additional confirmation, you may confirm that the current Heiken Matrix bar on a higher timeframe is also Blue before placing the Buy trade.

- We can also confirm the Buy trade entry by looking at the position of the Smoothed Moving Averages (SMMA) on the 15 minute chart.
Since we are planning to buy, the trend should be bullish, thus the entry level should be above the 55 SMMA and the 55 SMMA should be above the 200 SMMA. This step is optional.
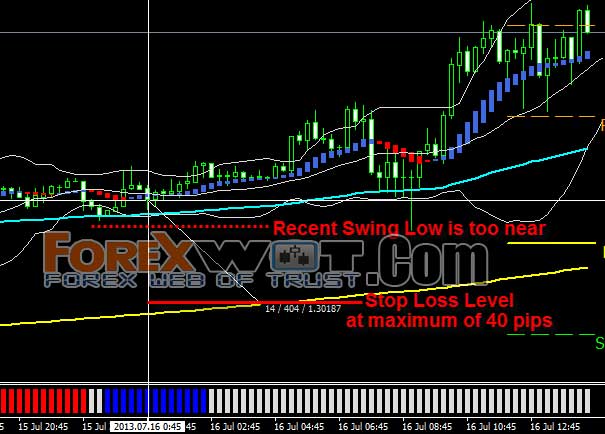
In the example below, the entry level is above the 200 SMMA and the 55 SMMA is above the 200 SMMA.
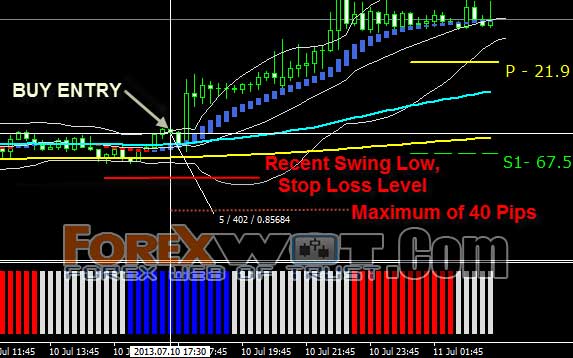
- Set the Stop Loss below the most recent swing low or at most 40 pips away from the entry level.For the example below, the recent swing low is less than 10 pips from the entry level.
- Set your Take Profit at the closest Forexometry level or exit the trade manually between 20-30 pips in profit. The recommended Take Profit (TP) for each trade is 100% or at least 75% of the Stop Loss (SL).
For example, if your SL is 30 pips, and your closest Forexometry level is only 10 pips, you should consider setting your TP at 20-30 pips from your entry level instead.
On the other hand, if your SL is 30 pips and the nearest Forexometry level is more than 30 pips away, you should again consider setting your TP at 20-30 pips from your entry level instead.
As we have discussed under the Buy Trade Rules, the Forex Profit Matrix works on all timeframes. I would suggest, though, that you use the 1 hour (H1) timeframe during volatile sessions like the London/NY session and, as you gain more experience, the 15 minute (M15) timeframe during quieter sessions like the Asian session.
The rules apply to all timeframes and you are welcome to use any other timeframes you prefer to trade. I will be using the 15 minute (M15) timeframe when describing the rules below.
- Wait for the Trend Booster indicator to turn Red in color.
- Wait for the Heiken Matrix bars to turn Red in color.
- As soon as the 2nd Red Heiken Matrix bar closes, place a Sell trade order at the open of the new candle.

- As additional confirmation, you may confirm that the current Heiken Matrix bar on a higher timeframe is also Red before placing the Sell trade.

- We can also confirm the Sell trade entry by looking at the position of the Smoothed Moving Averages.Since we are planning to sell, the trend should be bearish, thus the entry level should fall under the 55 SMMA and the 55 SMMA should be below the 200 SMMA. This step is optional.
In our example below, the entry occurs when price is below the SMMAs and the 55 SMMA is below the 200 SMMA.

- Set the Stop Loss above the most recent swing high or at most 40 pips away from the entry level.
- Set your Take Profit at the closest Forexometry level or exit the trade manually between 20-30 pips in profit. The recommended Take Profit (TP) for each trade is 100% or at least 75% of the Stop Loss (SL).
For example, if your SL is 30 pips, and your closest Forexometry level is only 10 pips, you should consider setting your TP at 20-30 pips from your entry level instead.
On the other hand, if your SL is 30 pips and the nearest Forexometry level is more than 30 pips away, you should again consider setting your TP at 20-30 pips from your entry level instead.

We’ve just gone through the buy and sell trade rules and I know that it’s much easier for you to grasp them fully by looking at different trade examples.
We will first take a closer look at buy trades and then the sell trades. I am going to provide you plenty of examples to help you fully comprehend and understand my system. We’ll look at how we will approach different types of trades when we encounter them on our charts.
Buy Entry on the EURGBP 15 Minute chart
For our first buy entry example, we will be using the EURGBP 15 Minute chart. The first indicator to look at is the Trend Booster indicator.
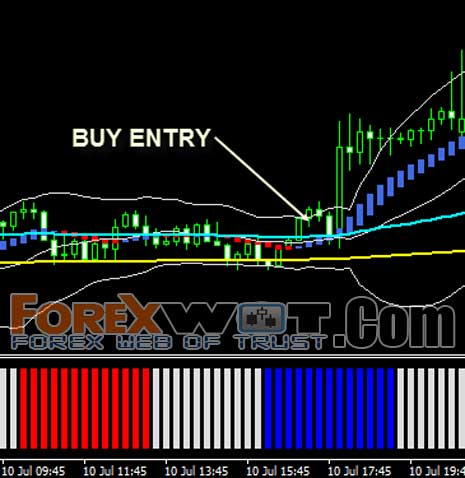
The first buy signal occurs when the Trend Booster turns Blue in color. The second signal is when the Heiken Matrix bars also turn Blue.
After the 2nd blue Heiken Matrix bar closes, we need to check that the Trend Booster remains blue and if these conditions are met, we can place a buy trade order at the open of the new candle.

Now that we have the buy entry level, the next thing we can do is to confirm it with a higher timeframe. Since we used the 15 minute timeframe, we should look at the 30 minute or 1 hour timeframe for confirmation of the trend.
On the image below, you will see that on the 1 hour timeframe, the current Heiken Matrix bar at the time we considered entering the Buy trade is colored Blue.
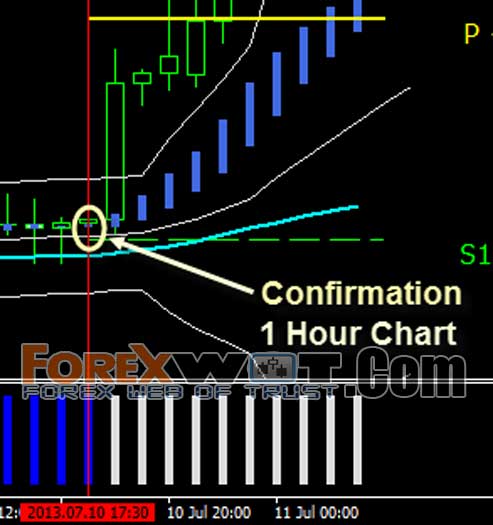
This is a positive confirmation for a buy entry.
Let us go back to the 15 minute chart to enter a buy trade. Place a buy trade market order at the open of the new candle.
We will set our Stop Loss level a few pips below the recent swing low or at a maximum of 40 pips away from our entry level.
The Take Profit level, on the other hand, should be placed at the closest Forexometry level or between 20 to 30 pips away from the entry level.
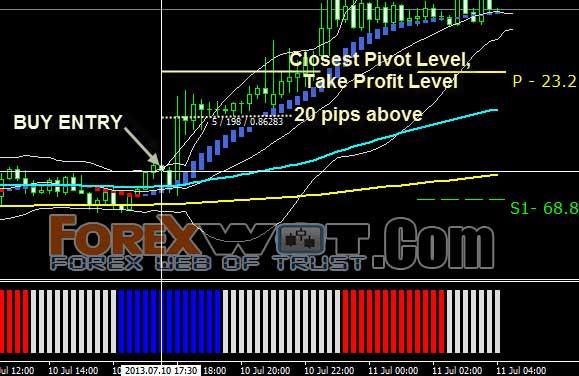
As you can see on the image above, after two (2) candles, the price hits our 20 pip target level. However, if we used the closest Forexometry Level as our Take Profit level, you will find that the target was hit after few more candles and the trade would still have resulted in a profit.
Sell Entry on the GBPCHF 15 Minute chart
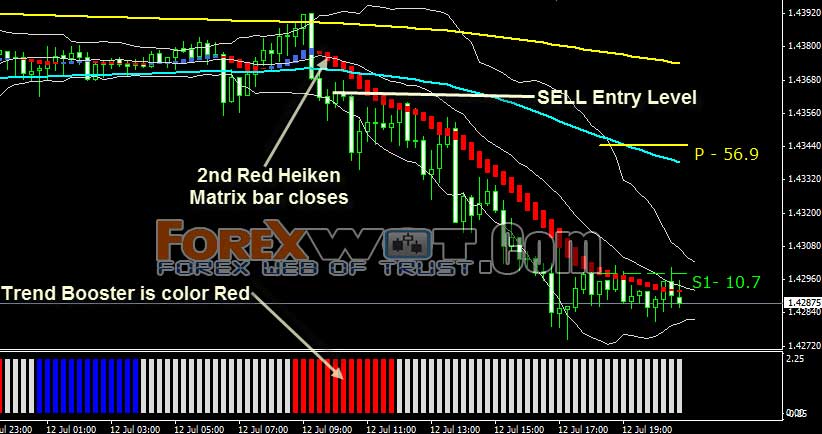
Our first sell trade example is on the GBPCHF 15 Minute chart. Just like the buy trades, we will first be looking at two indicators: the Trend Booster indicator and the Heiken Matrix bars.
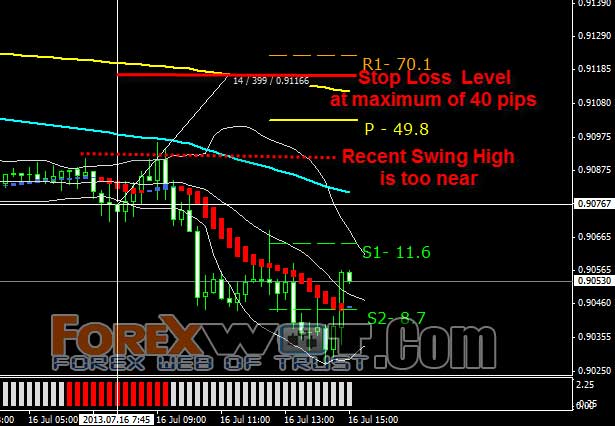
However, the Trend Booster and the Heiken Matrix should be Red in color. After the 2nd Red Heiken Matrix bar closes, we may look to enter the market with a sell trade order.
We’ll check the 1 hour timeframe for confirmation of the sell signal. On the image below, we can see that on the 1 hour chart, the Heiken Matrix bar is Red in color at the level where we wanted to enter the Sell trade.

We have to switch back to the 15 minute chart to place the buy trade at the open of the new candle that forms after the two Red Heiken Matrix bars have closed.

For this trade, we’ll place our Stop Loss level above the recent swing high.

Next, we will place our Take Profit level 30 Pips below our Sell entry because the closest Forexometry level is too close.
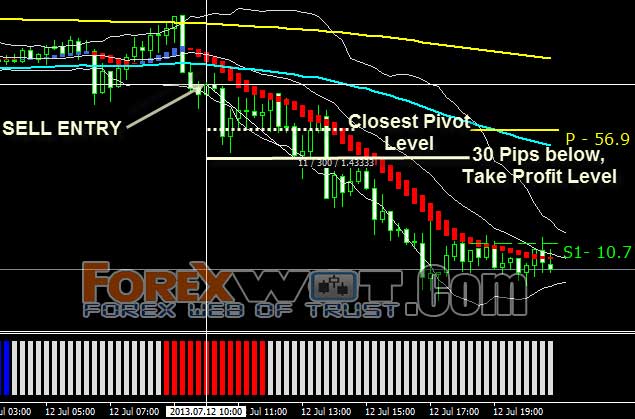
Price dropped over the next few candles and hit our Take Profit level of 30 pips.
We will be using the EURUSD 1 Hour chart for our first example.
The first thing to do is to wait for the Trend Booster indicator to turn Blue in color.
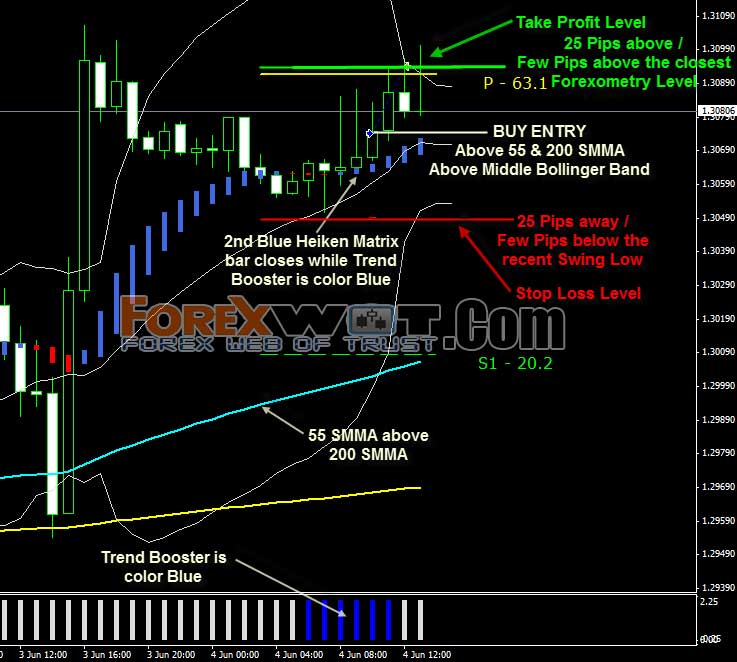
Second, we must wait for two Blue Heiken Matrix bars to form on the price chart while the Trend Booster indicator remains to be Blue in color.We need to make sure that when the 2nd Blue Heiken Matrix bars occurs on our chart; it is in agreement with the Trend Booster indicator.
Now that we have the two indicators in agreement, we have the confirmation to place the buy trade order. We can also look for another confirmation using the SMMAs. As you can see on the image above, the 55 SMMA is above the 200 SMMA. This gives us confirmation that the market is moving upwards. Another confirmation that we can use is the Bollinger Bands.
On this particular example, price action was above the middle Bollinger band for some time and on the recent swing low, price didn’t reverse when it touched the middle Bollinger band. Instead price bounced upwards off the middle Bollinger Band.
With all the evidence shown on this example, we may place the buy trade order at the open of the next candle as soon as the two Blue Heiken Matrix bars have closed. The next thing to do is to set the Stop Loss Level.
We targeted the Stop Loss level a few pips away from the recent swing low or approximately 25 pips away from our entry point. Since we have the Stop Loss Level, we now have to determine our Take Profit Level.
The Take Profit Level for this example is a few pips above the closest Forexometry level or approximately 25 pips above the buy entry level. As you will see on the above image, it only takes us 2 candles to hit our Take Profit level. This is a good example of a profitable buy trade using my system.
Again, we will be using the EURUSD 1 Hour chart for our second buy trade example.
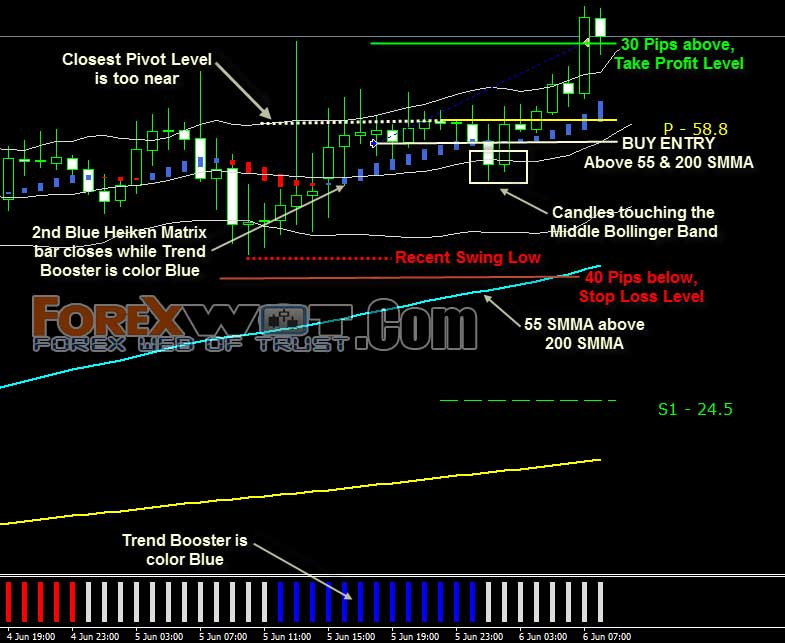
The first indicator to look at is the Trend Booster indicator. Since the Trend Booster indicator turns to Blue in color, it gives us a signal for a buy trade.
In this particular example, it was the Trend Booster indicator which first turns Blue in color. It doesn’t matter which of the two, the Trend Booster or the Heiken Matrix, first turns into the color Blue.
What matters is that both indicators should be in agreement and be colored Blue at the same instance. At the point where the Trend Booster indicator turned Blue, we now have to look at the Heiken Matrix bars and wait for them to appear Blue as well.
As soon as the 2nd Blue Heiken Matrix bar closes, we may enter the buy trade at the open of the next candle. There is also good confirmation from the SMMAs.
The 55 SMMA, as you can see on the image, is above the 200 SMMA. Also, the point where we wanted to place our buy trade order is above the 55 SMMA and 200 SMMA. This is great confirmation that the price is in an uptrend.
Now that we have determined the Buy Entry Level, we have to set the Stop Loss Level. Since the recent swing low is near the maximum of 40 pips loss, we may set the Stop Loss level at 40 pips below the buy entry level.
Next to establish is the Take Profit Level. For this example, we have set our Take Profit Level 30 pips above the Buy Entry point. As it turned out, the price is ranging a bit; where the price does not make enough upward or downward movement and bounces only in between a specific high price and low price.
After the ranging movement with few candles, the price touched the middle Bollinger band, and then continued to move in an upward direction. Then few more candles after touching the middle Bollinger band, we hit our Take Profit Level resulting in a healthy profit.
This is another good example of a buy trade taken using the Forex Profit Matrix.
Let’s look at another example, once again we will be using the EURUSD 1 hour chart.

Once again, we will notice that the Trend Booster was the first indicator to give us a signal that the market is moving upwards as it appears Blue.
The next thing that we will be doing after this is to wait for the Heiken Matrix bars to turn Blue in color to give us a confirmation. As you can see on the image above, there’s one Blue Heiken Matrix bar followed by a second. When the 2nd Blue Heiken Matrix bar closes, we also have a Blue Trend Booster.
This is a confirmation of a buy trade. As soon as the 2nd candle closes, we placed the buy trade at the open of a new candle.
We can also see that there’s the 55 SMMA representing by the aqua line. Even if we can’t see the 200 SMMA, we know for a fact that the 55 SMMA is above the 200 SMMA. This means that the market is in an uptrend.
We can also notice that the candles had started to form above the middle Bollinger band and that’s a good indication that the market is heading upwards. Also, we can see that the candles have started to form above the upper Bollinger band.
What we know about this is that this normally signifies a strong upward move is coming. With the confirmation from the SMMAs and Bollinger bands, we have confirmed that the buy trade order is a good position.
Next thing to do is set the Stop Loss and Take Profit Levels. We have targeted our Stop Loss Level at 40 pips away since the previous swing low is too far away.
On the other hand, we set our Take Profit Level at 30 pips above the Buy Entry Level. From what you can see, this is another good buy trade which we took using the Forex Profit Matrix system.
For this system, the recommended risk per trade is 2-5% of the account balance. That means for every trade you place, you only expose 2-5% of your account in each trade.
For example, if you have a $1,000 account and you want to risk 2% of this amount, then you’re risking $20 for each trade. That means if you lose the trade, you will only lose $20 of your account.
According to the rules, the take profit (TP) should be set at the closest Forexometry level or exit the trade manually as soon as you achieve a profit of between 20-30 pips. The recommended TP for each trade is 100% or at least 75% of the stop loss (SL).
That’s because it’s much easier for each trade to reach a closer TP than if you are aiming for 2 or 3 times the amount of SL. Basically, this technique increases the win rate.
Normally, I consider 40 pips as the maximum SL. However, the SL must always be based on the most recent swing high/low. Because of this, different trades will have different SL and TP levels, and in order to risk the right amount per trade, you need to use the correct lot size.
For example, if you use 40 pips as your SL then your TP can be from 30-40 pips. If you decide to risk only 2% of your $1,000 account and want to find out what lot size to use when you place the trade then enter this information into the calculator:
SL: 40 pips
Risk in percent: 2%
Account size: $1000
The answer should be: 0.05 lots or 5 microlots
Here’s another example. Supposing your account is $5,000, you want to risk 2%, and your SL is 30 pips, then your take profit should be from 22.5-30 pips and your lot size should be 0.33 lots.
SL: 30 pips
Risk in percent: 2%
Account size: $5000
Lot size: 0.33 lots
Some traders, although they have a big account, prefer to use only a portion of it to trade. In our scenario with a $5,000 account, you may only want to use $2,000 to trade. If you want to risk 2% of this amount per trade, then you should consider $2,000 as your account size and you will have 0.13 lots to use per trade.
SL: 30 pips
Risk in percent: 2%
Account size: $2000
Lot size: 0.13 lots
The stop loss and take profit will differ depending on the timeframe you are trading. For lower timeframes, they definitely should be smaller because it’s more difficult to hit a high take profit.
When trading on the lower timeframes like the 15 minute chart, set your stop loss 2 or 3 pips beyond the recent swing high or swing low.
For example, if the swing high is 20 pips from the entry price on the 15 minute chart, then your SL should be 22 or 23 pips. Your take profit can then be set from 17-22 pips.
If you want to risk 2% of your $2,000 account then your lot size to use for the trade is 0.18 lots.
SL: 22 pips
Risk in percent: 2%
Account size: $2000
Lot size: 0.18 lots
 Forex Golden Trading System With Such a High Winning Percentage
 2 MACD Effortless Forex & Stocks Swing Trading Strategy
 High Profits and Super Effective FCP Forex Trading System (Forex Secret Protocol)
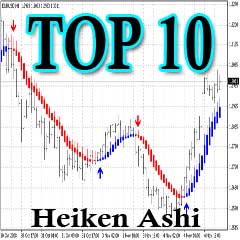 Top 10 Super Effective High Profits Forex Heiken Ashi Trading System and Strategy
 MA COBRA Forex & Stocks Trading Strategy (Extremely Low Risk High Reward Trading Strategy) (COBRA SYSTEM)
 Forex Day Trading System – How to Win Consistently in Forex Trading with Trend MA RSI and Multi ADX Trading Strategy
 Complete Guide To Forex Trading : Forex Long Term or Short Term Trading Strategy
 Forex and Crypto “MORNING TRADE” Trading Strategy for Advanced Traders
 Forex Profit Booster Trading Strategy – Most of The Time it Doesn’t Give False Signals
 The 10 Best Forex Currency Trading Systems & Strategy That Are Guaranteed To Work
