MT 4 Relative Vigor Index Forex Indicator & Trading System – Highly Effective Forex Relative Vigor Index (RVI) Momentum Trading Strategy with Momentum. A forex trading strategy designed to make maximum profits from a long-term uptrend can be created using the Relative Vigor Index, or RVI, in conjunction with other technical indicators.

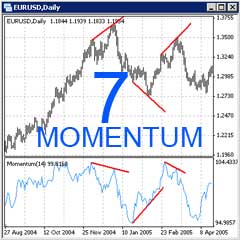
RVI compares closing price to price range and provides a reading of the strength of price movement up or down. Higher values for the RVI indicate increasing trend strength, while lower values indicate a lessening of momentum. As a momentum indicator, the slope of the RVI often changes direction ahead of price.
Forex Relative Vigor Index (RVI) Momentum Trading Rules
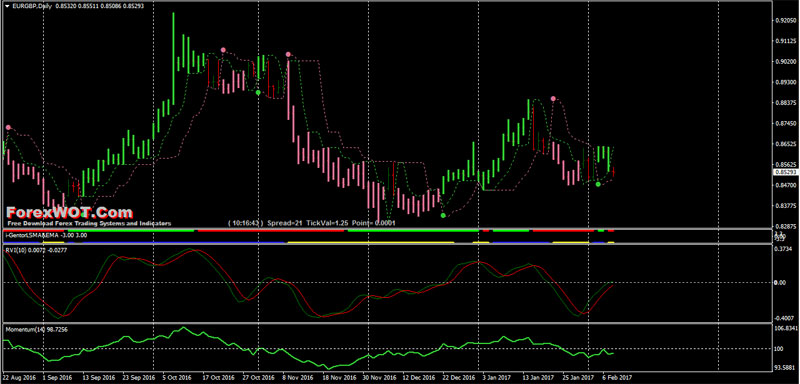
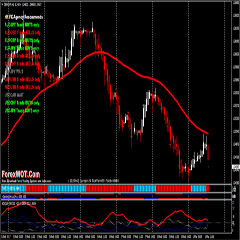
Forex Relative Vigor Index (RVI) Momentum Trading Strategy with Momentum is a trend following system for intraday and/or swing trading based on Forex Relative Vigor Index (RVI) indicator, PLT indicator filtered by I-gentor LSMA and momentum indicator.
This template is very clear, so the trading decisions are simple and immediate without confusion that can result from the use of many indicators (this is my personal opinion).
- Best Time Frame : 30 min or higher
- Forex Markets : any.
Metatrader Indicators:
- Relative Vigor Index (RVI);
- Momentum;
- PLT (period 3, 7) This indicator is also multitime frame, you can use with next time frame (for example if time frame is 30 setting the indicator 60 min but this is optional);
- I-Gentor LSMA&EMA (34,25, 3).
BUY Rules
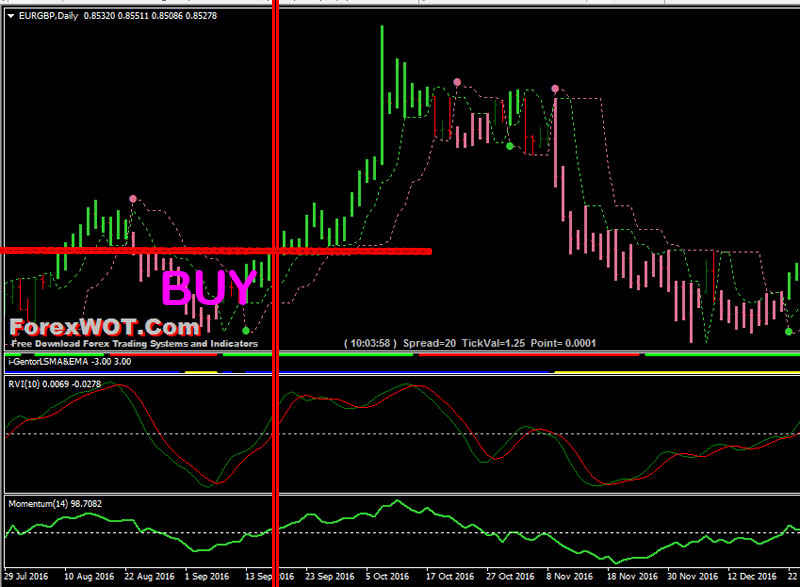
- RVI indicator upward
- Momentum indicator upward above 100 level
- PLT Green Dot confirmed by I-Gentor LSMA&EMA green line and blue line.
SELL Rules
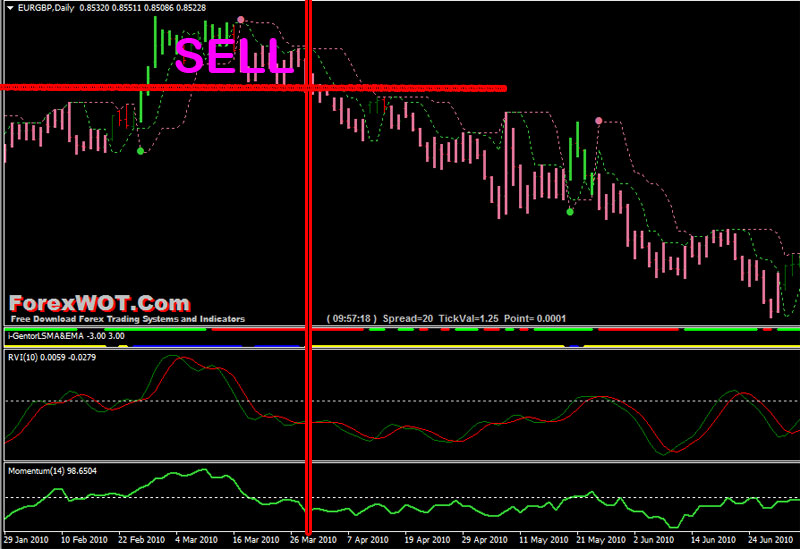
- RVI indicator downward
- Momentum indicator downward below 100 level
- PLT Red Dot confirmed by I-Gentor LSMA&EMA red line and yellow line.
A good way to use this template, is to use the PLT indicator in multi time frames as previously indicated.
EXIT Position
- Exit at the oppsite dot or with time frame predetermided with ratio 1.1 stop loss.
- Place stop loss below /above red line of PLT Indicator.
Other technical indicators are used to confirm trading signals given by the RVI. The strategy is as follows:
- Once the trader has a long position established in an overall uptrend, he or she monitors the RVI for bearish divergence from price. Price makes a new high, but the RVI does not make a corresponding new high.
- Confirmation of an impending retracement is sought by using another technical indicator, the Relative Strength Index, or RSI. If the RSI indicates overbought conditions in the market by readings above 70, this is taken as a confirming signal of the RVI divergence indication. The trader takes profit on half of his or her existing buy position.
- Assuming a retracement occurs, the trader looks to re-establish his or her full long position when the RVI shows a bullish divergence from price and the RSI indicates oversold conditions.
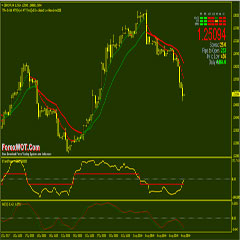
- The trader continues taking half profits, then resumes a full long position while the overall uptrend remains intact, as determined by price remaining above the 100-period moving average, or MA. On a close below the 100 MA, the trader closes out his or her entire position.
 Simple Trend Following Forex Relative Vigor Index with Profit Suprame Custome Indicators (RVI)
 Top 7 Best Forex Momentum Indicator and Trading System for Scalping or IntraDay Trading
 Forex BT Trend Trigger Trading with High Accuracy Color MA and RVI Relative Vigor Index Indicator
 Best 3 Most Effective Ways to Manage Your Open Forex Trades Better
 Forex and Crypto “MORNING TRADE” Trading Strategy for Advanced Traders
 Foreign Exchange Markets – Highly Accurate QQE Smoothed D1 Forex Trading System
 Forex Trading Course – How To Trade Foreign Exchange Market With TREND SQUEEZER Heiken Ashi Trading System
 Forex QQE Histo : Best Trading System To Instantly Improve Your Technical Trading Skills
 Top 10 Best Easy Simple and High Accuracy Low Drawdown Forex Trading Systems
 Best Momentum Indicators Forex Technical Analysis & Trading System
