Extremely high accuracy Forex Renko MACD Trading Strategy – This is a “mechanical” based method with a clear set of rules for qualified trade entries. This training manual will cover the basic criteria needed to identify a properly qualified trade entry. See also How to Install, Creating, and Setting Forex Renko Chart.

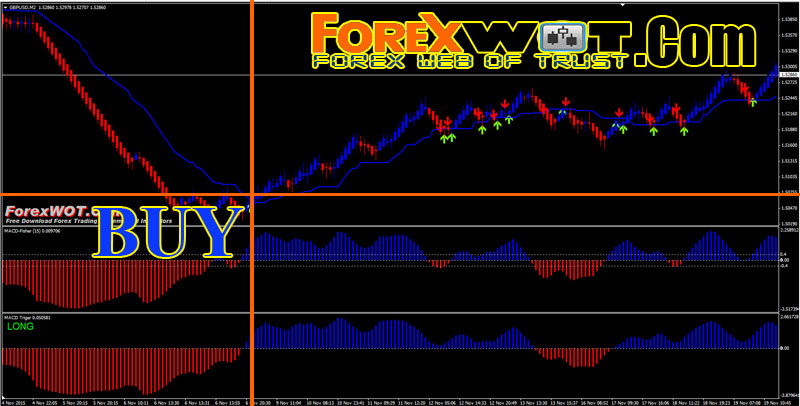
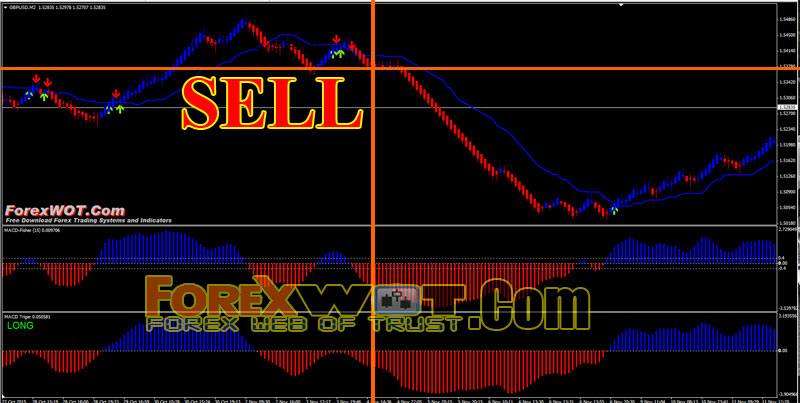
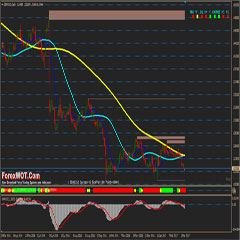
One of the primary rules of the Forex Renko MACD Trading Strategy is the need for price to trade through blue DynamicSR line. Once price trades above blue DynamicSR line, or below blue DynamicSR line, you are then eligible to start tracking for a trade entry signal.
A trend-following momentum indicator that shows the relationship between two moving averages of prices. The MACD is calculated by subtracting the 26-day exponential moving average (EMA) from the 12-day EMA. A nine-day EMA of the MACD, called the “signal line“, is then plotted on top of the MACD, functioning as a trigger for buy and sell signals.
There are three common methods used to interpret the MACD:
- Crossovers – As shown in the chart above, when the MACD falls below the signal line, it is a bearish signal, which indicates that it may be time to sell. Conversely, when the MACD rises above the signal line, the indicator gives a bullish signal, which suggests that the price of the asset is likely to experience upward momentum. Many traders wait for a confirmed cross above the signal line before entering into a position to avoid getting getting “faked out” or entering into a position too early, as shown by the first arrow.
- Divergence – When the security price diverges from the MACD. It signals the end of the current trend.
- Dramatic rise – When the MACD rises dramatically – that is, the shorter moving average pulls away from the longer-term moving average – it is a signal that the security is overbought and will soon return to normal levels.
Traders also watch for a move above or below the zero line because this signals the position of the short-term average relative to the long-term average. When the MACD is above zero, the short-term average is above the long-term average, which signals upward momentum. The opposite is true when the MACD is below zero. As you can see from the chart above, the zero line often acts as an area of support and resistance for the indicator.
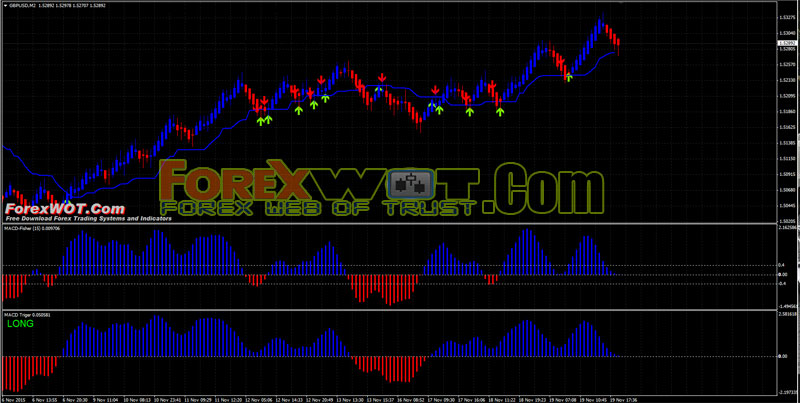
The Forex Renko MACD Trading System was specifically designed with 2 MACD channels to keep you out of trading in false signal.
- Price above DynamicSR
- Real HeikenAshi candles blue
- MACD Fisher blue and above 0.4 line
- MACD Triger blue
- Price below DynamicSR
- Real HeikenAshi candles red
- MACD Fisher blue and below -0.4 line
- MACD Triger red
The Forex Renko MACD Trading Strategy is incredibly simple and easy to use. this is a mechanical system, which means you will be getting fixed entry and exit signals which tell you exactly what to do and when.
 2 MACD Effortless Forex & Stocks Swing Trading Strategy
 How Do I Become a Good and Prifitable Forex Trader
 Foreign Exchange Currency Trading & Investment Strategy – Forex Z 20 System for Successful and Highly Profitable Forex Trader
 FREE DOWNLOAD 20+ Best Forex MACD-Moving Average Trading System
 High Accuracy Volty Channel Stop RSI Trading Strategy and How to Win Consistently in Forex Trading
 10 Very Easy and Accurate FOREX MACD Trading System
 Learn Forex Trading Online – FGM MACD Profitable Forex Currency Trend Following Trading Strategy
 Forex Bill Williams Market Facilitation Index (BW MFI) Multi Trend Trading System and Strategy
 Forex Multi MACD Ichimoku Trend Trading Strategy with Moving Average and ADX Indicator (ADX)
 Forex Profit Booster Trading Strategy – Most of The Time it Doesn’t Give False Signals
