Forex RSIOMA NRTR Trading System – RSIOMA is an advanced version of RSI. We are going to start off with learning the RSIOMA to keep us on the correct side of the trade.

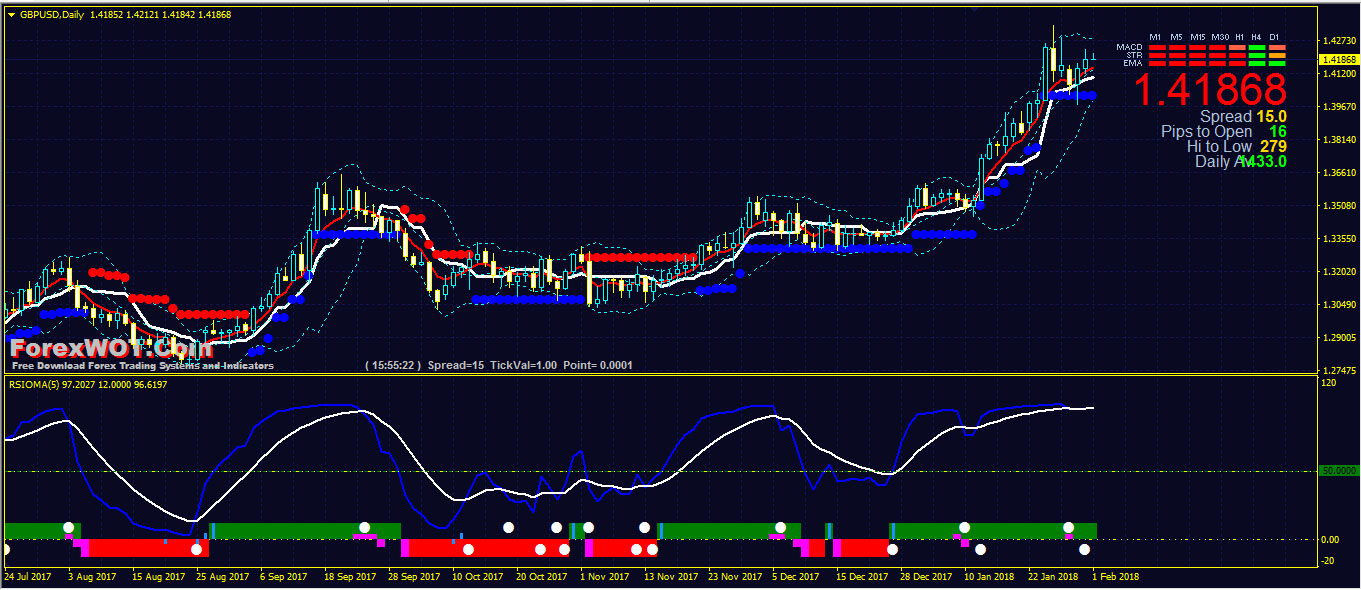
On the picture the bold blue line is RSI of the Moving Averages, the white line is its Moving Average.
- RSI above MA and RSI above level 50 is a signal of a BULLISH trend.
- RSI below MA and RSI below level 50 is a signal of a BEARISH trend.
- One can also BUY when the RSI breaks level 20 from below and SELL when RSI breaks level 80 from above, but those are weaker signals.
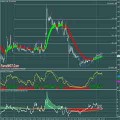
The histogram provides quick reference.
Green lines signal BUY, red signal SELL, magenta mean overbought, blue mean oversold.
This is a high accuracy RSIOMA strategy Using the 50 trigger line.
Combining the rules outlined above, long and short positions can be taken based on where the RSI is trading.
- Best Time Frames: H1, H4, and Daily
- Most Recommended Currency Pairs: GBPUSD, EURUSD, and USDJPY
- RSIOMA (RSI of Moving Average)
- NRTR
- Ichimoku Kinko Hyo
- Moving Average
- Bollinger Bands
- Signal Trend
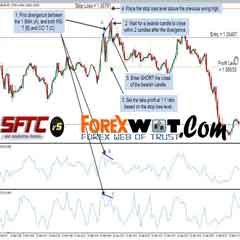
Long (BUY) positions are taken when the RSI is above the Moving Average and breaks above the 50 level. Short (SELL) positions are taken when the RSI breaks below the 50 level and is below its Moving Average.
The chart below shows the LONG and SHORT example positions that can be taken when the RSIOMA signals the appropriate BUY and SELL conditions.
Stop losses can be set to the recent significant low for long positions and significant highs for short positions.
Trades can be excited when the RSI crosses its Moving Average.
Take a look at the image below.
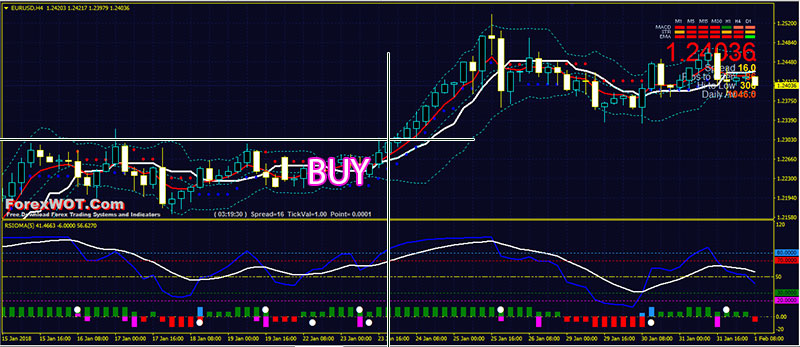
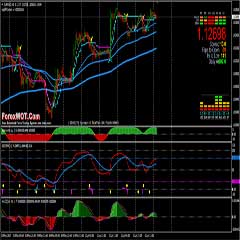
- RSIOMA (RSI of Moving Average) – the RSI line (blue color) is above the Moving Average (white color) and breaks above the 50 level.
- RSI of Moving Average histogram green color
- NRTR blue dots
- Red color 5 EMA line above the white line Tenkan-Sen Ichimoku Kinko Hyo
- Price upward and break out the upper Bollinger Bands
- Signal Trend green color bars
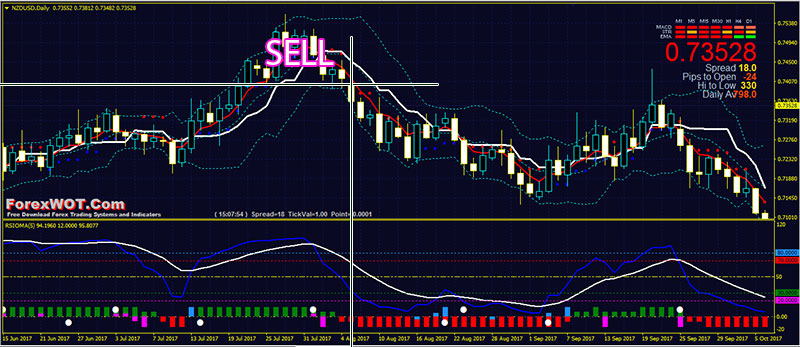
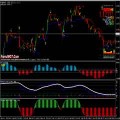
- RSIOMA (RSI of Moving Average) – the RSI line (blue color) is below the Moving Average (white color) and breaks below the 50 level.
- RSI of Moving Average histogram red color
- NRTR red dots
- Red color 5 EMA line below the white line Tenkan-Sen Ichimoku Kinko Hyo
- Price downward and break out the lower Bollinger Bands
- Signal Trend red color bars
- Place Stop loss 2 pips above or below the previous candle.
- Predetermined Profit Target ratio 1:2 with stop loss (if stop loss is 30 pips the profit target is 60 pips.
- If one is earning 60 pips is recommended to insert the trailing stop of the 20 pips.
 M15 Forex Trend CCI RSIOMA With Heiken Ashi Exit Trading System
 Forex Solar Winds Joy RSIOMA Trading (Best Forex Trend Indicators and Trading System)
 How to Immediately Become A Successful Forex Trader with RSIOMA Trend Magic Trading System and Strategy
 MA COBRA Forex & Stocks Trading Strategy (Extremely Low Risk High Reward Trading Strategy) (COBRA SYSTEM)
 Foreign Exchange Trading : Online Forex Master Level Trading System and Strategy
 FREE DOWNLOAD 20+ Best Forex MACD-Moving Average Trading System
 M1 M5 RSIOMA Forex Scalping Trading System With AUTO Fibonacci Retracement Indicator
 The 10 Best Forex Currency Trading Systems & Strategy That Are Guaranteed To Work
 2 MACD Effortless Forex & Stocks Swing Trading Strategy
 5 Minute Chart Surefire RSI-CCI Forex Trading System and Strategy
