High profits Forex RSI Trend Reversal Trading System – Relative Strength Index, or RSI, is similar to the stochastic in that it identifies overbought and oversold conditions in the market. It is also scaled from 0 to 100. Typically, readings below 30 indicate oversold, while readings over 70 indicate overbought.

RSI can be used just like the stochastic. We can use it to pick potential tops and bottoms depending on whether the market is overbought or oversold.
RSI is a very popular tool because it can also be used to confirm trend formations. If you think a trend is forming, take a quick look at the RSI and look at whether it is above or below 50.
If you are looking at a possible uptrend, then make sure the RSI is above 50. If you are looking at a possible downtrend, then make sure the RSI is below 50.
The Relative Strength Index is going to measure price changes over the past X periods (with X being the input that you can enter into the indicator.)
If you set RSI of 5 periods, it will measure the strength of this candles price movement against the previous 4 (for a total of the last 5 periods). If you use RSI at 55 periods, you will be measuring this candles strength or weakness to the last 54 periods. The more periods you use, the ‘slower’ the indicator will appear to react to recent price changes.
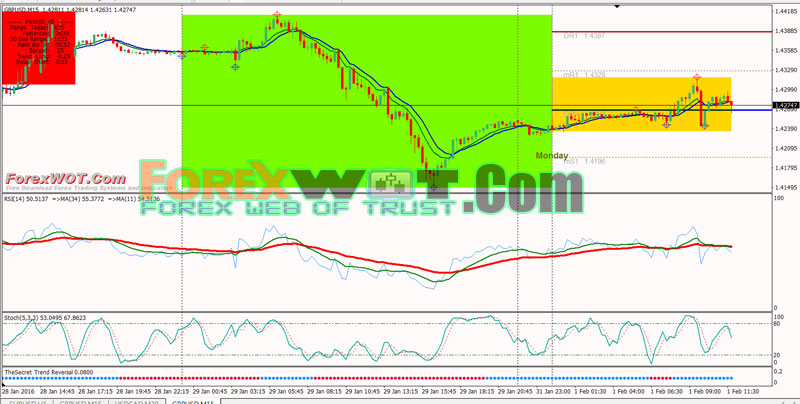
This forex scalping system is not for beginners. In this Forex RSI Trend Reversal Trading System Stochastic indicator is a great filter.
Best Time Frame : 15 min or higher;
Currency pairs major : (EUR/USD, GBP/USD, USD/CHF, USD/CAD, AUD/USD,).
Metatrader Indicators:
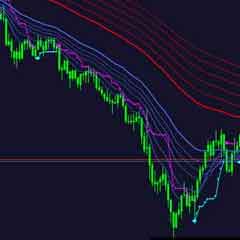
- Rainbow Multi Moving Average
- SFX MCL indicator;
- RSI Indicator (5-period) with two moving averages 11 and 34 periods;
- Stocastic Indicator (14,3,3)-low-High;
- Pivot points Levels;
- Trend Reversal indicator;
- Price above upward Rainbow MMA
- Rainbow MMA above upward SFX MCL indicator
- SFX MCL indicator line green >line blue
- Wait crossing upward the RSI indicator, Moving Average of 17 and 34;
- Trend Reversal indicator bars acqua;
- Stochastic indicator crosses upward but is not in oversold Zone.
Not to Buy:
- if the Stochastic indicator is in oversold Zone;(Stochastic as filter)
- if the RSI indicator is >80;

- Price below upward Rainbow MMA
- Rainbow MMA below downward SFX MCL indicator
- SFX MCL indicator line green <line blue
- Wait crossing downward the RSI indicator, Moving Average of 17 and 34;
- Trend Reversal indicator bars red;
- Stochastic indicator crosses downward but is not in overbougt Zone.
Not to Sell:
- if the Stochastic indicator is in overbougt Zone;(Stochastic as filter)
- if the RSI indicator is <20;

- When SFX MCL Revesal position;
- Profit Target 5-8 pips (example AUD/USD 6 pips, EUR/USD 7 pips, GBP/USD 8 pips);
- exit at the pivot points levels;
- Stop loss 10 pips below or above the entry bar.
Basic Usage of RSI
Because the indicator can show potentially over-bought or over-sold conditions, traders will often take this a step further to look for potential price reversals.
The most basic usage of RSI is looking to buy when price crosses up and over the 20 level, with the thought that price may be moving out of oversold territory with buying strength as price was previously taken too low.
 20 Halloween Costumes From Amazon All Traders will Actually Want To Wear
 FREE DOWNLOAD 20+ Best Forex MACD-Moving Average Trading System
 2 MACD Effortless Forex & Stocks Swing Trading Strategy
 Forex and Crypto “MORNING TRADE” Trading Strategy for Advanced Traders
 How to Do Accurate Forex Trend Line Analysis
 Advanced Moving Average Forex Trading Tutorial – How To Become A Successful Forex Trader With Moving Average Indicator
 MA COBRA Forex & Stocks Trading Strategy (Extremely Low Risk High Reward Trading Strategy) (COBRA SYSTEM)
 TOP10 BEST Full Time Forex Trader Trading System and Strategy
 TOP 10 Best Bollinger Bands Forex Trading System and Strategy
 Forex Made Easy – Cynthia’s Exponential MA Forex Trading System
