Forex Super TendLines Trading System With MACD and RSI Indicators – Now, let’s get started! To display the system indicators onto your chart, right click on chart then choose: Template >>>> ForexWOT-SuperTrendlines – just like this! Now your chart should look like this one:


Before we move to the trading rules, you must check one thing first… You must specify the time frame you want with the Trend Channel indicator. As I said before, the Trend Channel indicator is to show the trend of the higher timeframe on your mainly traded timeframe.
The default parameter TimeFrame of the indicator is 60 minutes. But you can also use higher time frame like 4 Hours ( 240 ) or daily ( 1440 ) If you wish to use higher trend than the default time frame. For example, if you want to trade on 30 minutes or 1 hour timeframe, you’d want to check the trend on the Daily timeframe, so you set the TimeFrame parameter to 1440.
Now everything is ready so let’s start trading ..!
The first step is to check the main trend you’re going to follow. Let’s make a sample trade to illustrate the Forex SuperTrendlines system. We will trade EUR/USD on 1H chart. So all we need to do now is to open higher time frame. For example, the daily chart. Okay, so let’s open the daily chart and only check the daily trend (don’t forget to change the time frame for the Trend Channel indicator to 1440 )…

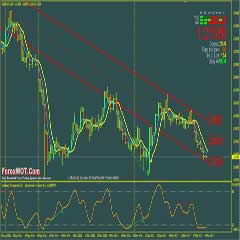
What can we see on daily chart…?
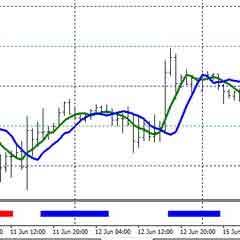
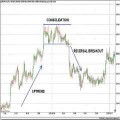
We can see that the trend is in a clear/strong up movement and we can also see that it’s leaving a clear support level and moving upwards.
We also have white candles and the A.O indicators shows white bars ( or up trend movement ).
Oh I almost forgot, the red/white candles you can see on the chart are plotted using the Volatility Quality candle indicator. Anyway, you don’t need to understand about this indicator. It is used to filter out some noises on your chart and it’s mainly used here for visual confirmation of entry points.
Okay, by looking at all the indicators on the chart, we can come to the conclusion: EUR/USD main trend is Up Trend.
That’s all that we need to know from the daily chart. Next, we should move back to 1 Hour chart, or the chart that we are mainly going to trade with.

Now we know that we are going to whether:
- Trade in the direction of the trend ( Buy only ) or…
- We are going to trade the reversal ( if a divergence is detected )
As you can see from the sample chart here, there is no divergence detected at this time. So we are going to simply follow the trend and only open buy orders.
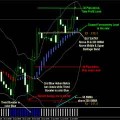
And here is where we should enter and place our stop loss:

Remember, as I mentioned before that we don’t place the stop right on the indicator’s level. But on the lowest price before the support level. Okay, let’s see what happened a few hours later.

The price moved upward as we expected and 100 pips have been made in a single trade.
So now, next to another important factor…
When to exit the trade? There are many options and all are effective and profitable, here are few that you can use with this system…
Option 1 is:
You can wait until a new support/resistance is formed and exit right after the new level is created.
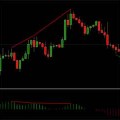
For example, let’s go back to the previous trade: we can see a new resistance is formed, so we exit right there.

Notice that not only a new resistance is formed, but it was formed after price hit the upper channel’s trend. That means it’s a powerful resistance and closing the trade at this point would be the best choice.
Sometime the support/resistance indicator would show a sign like this one :

This sign simply shows you the best place/time to exit the trade. When you see this sign, wait for 1 or 2 bars to be formed after it and if the sign remains, close your opened trade.
Now, let’s go to exit option 2:
This option is to use fixed numbers of pips for take profit. This number could be static ( never changes, for example .. 40 pips per trade ) or dynamic ( changes according to changes in another element .. for example, Target is twice as Stop loss ).
Okay, I have finished sharing with you how to trade in the direction of the trend using my Forex Diversity system.
Now I’m about to explain with you how trade the reversal ( if a divergence is detected )
In the previous examples we discussed how to follow the main trend. In this example we are going to see how to trade if a divergence was detected.
In this case, the trend indicators could show a clear trend (for example , up trend ) but at the same time, the A.O indicator would show a divergence or a possible reversal (down trend).
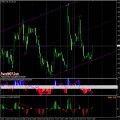
Here’s an example…

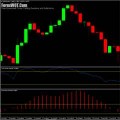
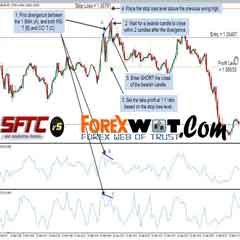
Here we can see that the price is trending up. RSI bars and the Trend Channel indicators also confirm the up trend. However, take a look at the Awesome Oscillator, it’s trending down. If you choose to trade the divergence, you are going to open a sell trade based on the divergence signal. You’ll want to open the trade when the AO bar becomes negative.
Entry and exit is the same as the trend following rules. Wait until a new support/resistance is formed, open trade, then close after a new support/resistance is formed.
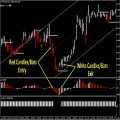
Notice that in this case, you should see similar colors in price candles and A.O bars to confirm your entry/exits.
Here’s how we confirm the entry/exits…

Okay, so the divergence happened. And we can see the AO bar become negative here (at the same time the price candles are also red). So we can confirm the SELL entry here.
Now, many bars later, you can see the trade went smoothly and you can get some nice profits from the SHORT trade. But you can see a new support level was formed, so it’s time to exit the SHORT trade. Also the AO bars and the price bars now have same white color. So this confirms it’s time to exit now!
Because you would be trading against the trend, it’s recommended that you exit your trade as fast as possible and don’t keep the trade open for long time.
 2 MACD Effortless Forex & Stocks Swing Trading Strategy
 FOREX 1 MIN Scalping Trading Tricks By The Most Successful Forex Trader
 5 Minute Chart Surefire RSI-CCI Forex Trading System and Strategy
 Forex Currency Trading Course : How to Trade Forex Successfully with U-TURN Cross Over Trading System
 Forex Trading Training : How to Use MACD Divergence Profitable Forex Strategy In 4 Easy Steps
 Forex Diversity : Optimized Trend Trading Strategy
 Forex Profit Matrix – Stay in Strong Trends with the Heiken Ashi Candlestick and Bollinger Band
 Best Forex Trading Software and System For Divergence Pattern Analysis
 Forex Currency Trading System – Highly Profitable Forex Divergence Trading System and Strategy You Must Know
 MACD RSI Trading – The Easiest Way To Measure Forex Reversal Breakouts
