Tricks Of The Successful Forex Trader. IMPORTANT: In order to achieve good results you must read AND FOLLOW THE MAJOR RULES BELOW!

- Recommended Time Frames: 15 min, 1 hr and 4 hr
- DO NOT USE for scalping in a 1 min or 5 min chart,
- Trade according to color only, do not use price lines or candlesticks.
- All colored signals need to be the same before you enter a new position.
- Pairs: all major pairs that trend well.
- Use sensible money management.
- Stop Loss: Use 1:1 or 1:2 TP and SL.
- As with any trend trading system, you are looking for breakouts and trying to avoid consolidation periods.
Of course not every trade will be profitable, there is no holy grail in Forex. Losing trades will be closed by your trailing stop loss automatically but by the end of the month a good profit is sure to be yours.
- pick out 3 major trending pairs to trade (or only 2 pairs if your screen isn’t very wide)
- make a profile that has the 4 hr charts at the top going across and then a 1 hr chart under those going across and then a 15 min chart under the 1 hr charts going across
- attach the template to each chart
Bellow has a screenshot to illustrate the profile setup:
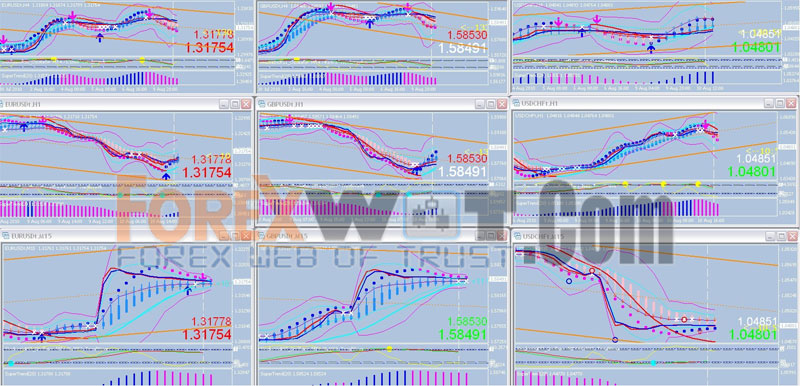
The top row going across are the EurUsd 4 hr chart, the GbpUsd 4 hr chart and the UsdChf 4 hr chart. The 2nd row are the same pairs but 1 hr charts. The 3rd row are the same pairs but 15 min charts.
Now when you are looking at a currency pair, you first look at the top 4 hr chart to determine the major trend.. then look down at the 1 hr chart underneath to see the medium trend, and then look down at the 15 min chart to see the faster trend.
At the far right is a dotted white vertical line that follows the price….you can always quickly at a glance see where the price is at.
I only use a 5 min chart to trade news events….other than that, there’s too much noise and the whipsaw is too great during consolidation periods.
I’ll go thru each indicator and explain how to use it…and I’ll show a screenshot with some explanations.
The Trend Channel are the orange lines. The slope of the Trend Channel tells you at a glance in each timeframe what the price is doing…going up, down, or flat.
The best way to use the Trend Channel is to trade off of the extreme channel bounces.
So when the price reaches the upper resistance channel and starts to head back down, and all colored signals are the different shades of pink, hot pink or red, and they are lined up to show a downtrend, then place a sell order.
If the price is bouncing off the bottom channel support line and starting to head back up, and all colored signals are the different shades of blue, then place a buy order.
If the movement is strong, the price will reach the extreme opposite orange trend line…if it stalls out at the orange dotted mid-line, then wait to see what happens next. Most often, if the move is strong, it will continue to the extreme channel line and bounce off of it.
Please be aware that if the price movement is VERY strong and keeps pushing against a trend channel line, it will push the channel trend line and expand it…it’s a flexible trend line that does change.
If the main trend is slowing down, then the price will retrace off of the dotted orange mid-trend line and eventually push against an upper or lower channel line…in other words, when a price movement is reaching exhaustion, it won’t break thru the orange dotted mid-line…it will reverse and sooner or later push against the support or resistance orange channel lines at the outside.
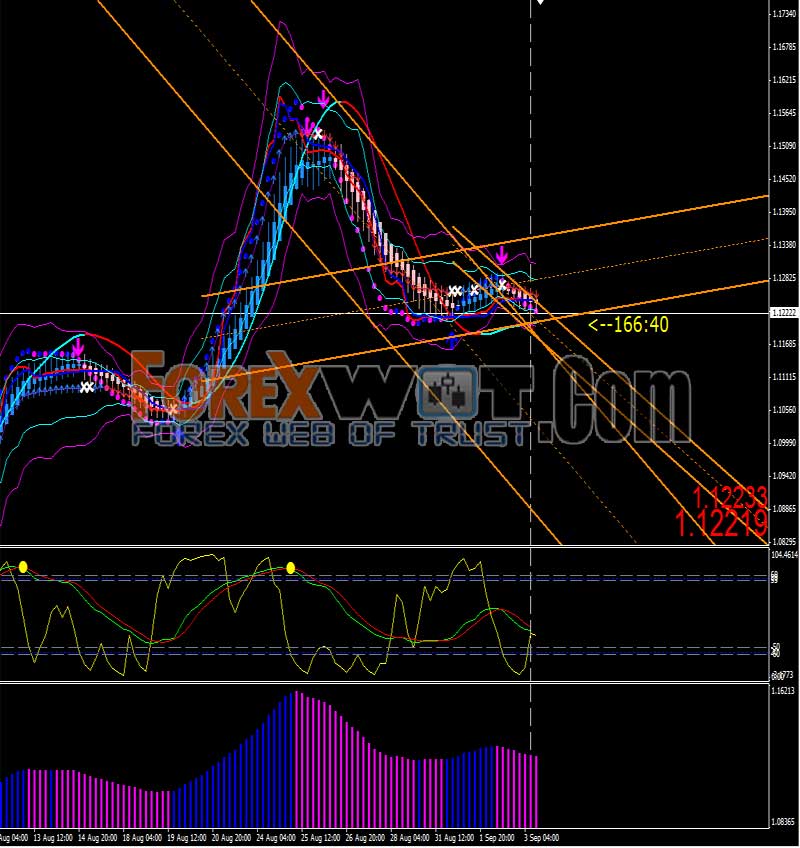
The 4 hr chart below illustrates perfectly how the upward trend of the EurUsd has stalled out on August 3, and can’t go above the dotted orange mid-trend line…on August 9, it has broken down below the original upward support channel line …and is hanging around right on the dotted mid-line in the now downward sloping channel, so the upward trend is exhausted for the time-being and the downtrend is slowed down. The RSI is turned upward on August 10 towards the 80 line, but if it turns down, then the selling will continue.
At this point, in the 4 hr chart, the price is in limbo around the dotted orange mid-trend line, so I’ll trade in the 1 hr or 15 min chart instead.
Instead of a candlestick or price line, I use a smoothed Heiken Ashi candle indicator with an alert, and a non-lag dot.
In the bottom window, I use the Super Trend which is color coded to match the Heiken Ashi candle and the non-lag dot in the main window. The Super Trend is less lagging and can signal the exhaustion of a trend a little earlier.
For the long term trend, I use the Trend indicator. In the 4 hr chart, I changed the default slope from 80 to 40. In the 1 hr chart, I left the slope at default 80. In the 15 min charts, I changed the default of 80 to 60.
I NEVER trade against the trend of this indicator, whatever timeframe I am trading in.
In the middle window, I use a Stochastic/RSI indicator and a Trend Wave indicator.
The Stochastic/RSI uses the typical 20/80 oversold/overbought lines and the RSI shows the volatility of the price action. Look for the yellow line to bounce up from the bottom 20 line, signifying increased buying strength…and increased selling strength when it bounces down from the upper 80 line.
The Trend Wave is two colored lines that get flat and crunched together when in a consolidation period…you can see them separate when the trend is strong in one direction or another.
When a buying trend significantly slows down, you’ll see a large yellow dot at the top of the 80 line. When a selling trend stalls out, you’ll see a large aqua blue dot at the bottom of the 20 line. These dots can re-paint and can be premature, so you have to confirm with the Super Trend. I never take any action based on just the Trend Wave….but if a dot appears and the two lines are flat and together, it’s a signal that the trend is slowing significantly.
The Super Trend goes into the bottom window and shows the trend direction and strength, much like the MACD, but is much less lagging than the MACD. It co-incides most of the time with the non-lag dots. I use both of these indicators to tell me when to enter or exit a trade.
The next page shows 3 screenshots for a EurUsd 4 hr, 1 hr and 15 min charts, showing what I’ve just described using the Trend Channel and the basic indicators:
In the 4 hr chart above, you can see that since July 26 (which is ½ way thru the chart), the buying trend never went past the orange mid-dotted line…so the buying strength is not that strong and has been slowing down… until finally on August 9, the price fell below the bottom channel support line and is now in a downward channel. This could be the end of the uptrend or a temporary price correction downward…if it bounces off the bottom support channel line and heads back up, then the price might resume it’s upward trend that it’s been in since June.
However, if the price breaks down below the new downward sloping channel support line, then the EurUsd is breaking down and a major new down trend is probably being established. (on Wed Aug 11, this is exactly what happened)In the EurUsd 1 hr chart below, you can see the new Trend Channel that has formed with a downslope:

In the 1 hr chart above, you can clearly see the sell point off of the top extreme orange Trend Channel resistance. The first vertical black line shows the perfect sell entry. And in the bottom window you can see the two Wave Trend aqua blue round dots sitting on the 20 oversold stochastic line signaling that the bottom has been hit. The 2nd black vertical line shows the exit place when all signals have turned blue.
Now let’s look at the EurUsd in a 15 min chart:
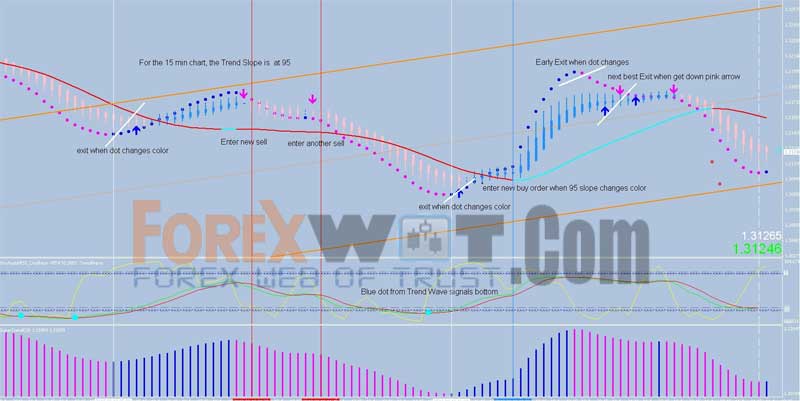
In the 15 min chart above, I added the G (groovy) Spot arrows….hot pink is sell, blue is buy.
It’s easy to see the 2 sell points shown by the red vertical lines…but to stay in the downward trend, I had to turn the Trend Indicator slope signal to 95 (80 is default). For a 15 minute chart, the 95 slope keeps you in the trend longer and avoids whipsaw trades. If you want a more sensitive slope line, the 15 min profile chart is set to 60. What’s hard to know is when to take some profit…it’s not that clear, but profit-taking is drawn by the short white lines.
You can close out a trade when the non-lag dot changes color… but it can re-paint so wait for two dots of the same color to confirm the exit….or, look at the Super Trend in the bottom window…if it has changed to the same color as the first non-lag dot, then you can close the trade.
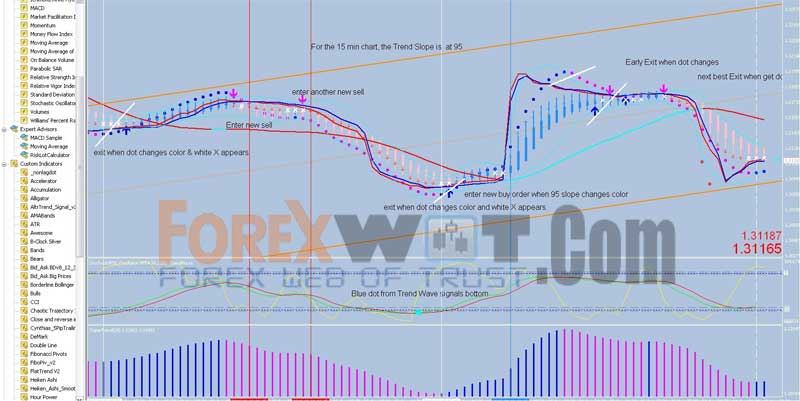
The chart above has two perfect sells close to the top of the orange Trend Channel resistance line.
Remember that the best entries are at the extreme top and extreme bottom of the orange Trend Channel lines.
The exit is clear when the dot changes color, the white X appears, the Trend Wave gives a blue dot earlier to signal the end of the down trend, and the Super Trend bars in the lower window change color.
Seeing entries and exits should become very easy to spot with just a little bit of practice.
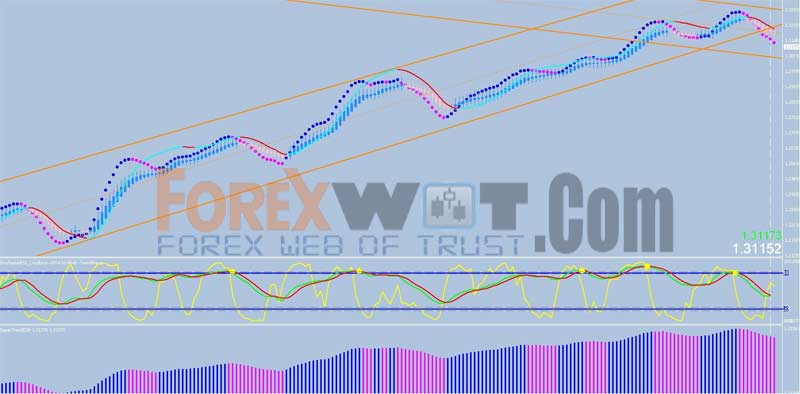
Now let’s look at a 1 hr EurUsd chart with all the indicators. The Trend Slope is at default 80 for the 1 hr chart.
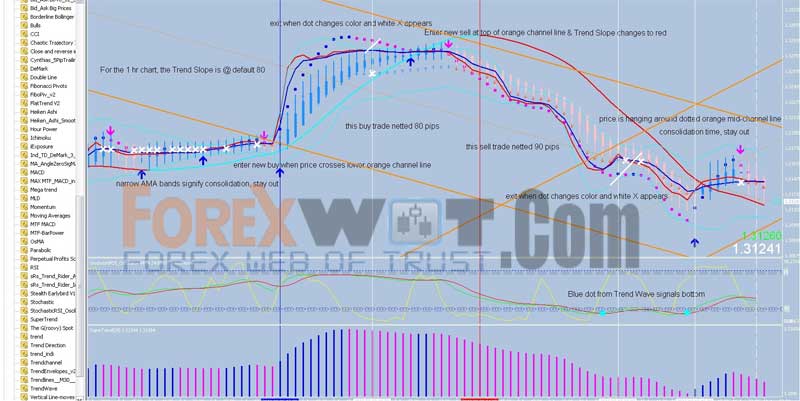
On the left side of the chart 1 hr chart above, you have lots of white X’s….the white X’s combined with narrow Bollinger bands signify consolidation, ranging of price, and is not a tradeable condition.
Wait for a clear breakout, as occurs when the price breaks above the bottom Trend Channel orange line. Here I went long, and exited when the blue dots changed to hot pink and the white X appeared. This buy trade netted 80 pips.
When the Trend Slope changed from blue to red, I went short and exited when the price hung around the dotted orange mid-channel trend line, and the hot pink dot turned blue and the white X appeared. Before the exit, the blue dot from the Trend Wave appeared in the lower window, signifying a slowing of the sell-off.
And last, let’s look at a 4 hour chart with all the indicators.
For the 4 hr chart, I’ve changed the Slope Trend setting from 80 to 40. This way, we stay in the main trend without giving back too many pips when the trend changes, plus we have entries that are conservative and safe.
The AMA Band settings are changed as follows to keep the chart clean and uncluttered:
- # 0 = change to None (changes to black)
- #1 = leave as is
- #2 = leave as is
- #3 = change to White and change Width to 5
- # 4, 5,6,7 = change to None (changes to black)

During this time period, the trading started on July 6 and continued to August 9….for a total of 1294 pips with 9 trades.
Trading was relaxed because the color coding made it visually easy to see the entries and exits. The Trend Channel made it easy to see the upward trend and the trend change towards August 4th when the upward trend slowed down.
At this point in time, August 10, the price is in a downsloping channel and has crossed the orange dotted mid-channel trend line. If the price continues to the bottom of the Trend Channel support line, we will see either a bounce off the bottom to go bullish again, or, if the price breaks below the support line, we will be seeing further downtrend.
Clearly, the least stressful and easiest trading is in the 4 hour chart.
However, we haven’t talked about stop loss placement yet, so it’s time to address it.
If you use the AMA Bands and leave the inner aqua Bollinger bands intact, you could place and trail your stop loss just on the aqua Bollinger band. Make #4 & 5 Aqua in the settings Color tab.
Or use a 100 pip stop loss and trail with 50 pips using your Mt4 platform.
 20 Halloween Costumes From Amazon All Traders will Actually Want To Wear
 MA COBRA Forex & Stocks Trading Strategy (Extremely Low Risk High Reward Trading Strategy) (COBRA SYSTEM)
 2 MACD Effortless Forex & Stocks Swing Trading Strategy
 FREE DOWNLOAD 20+ Best Forex MACD-Moving Average Trading System
 TOP10 BEST Full Time Forex Trader Trading System and Strategy
 Best Forex Trading Software – A Simple Forex Binary Holy Grail Trading System & Strategy
 Forex Advanced Breakout Trend Easy and Simple System for Trading Success
 Foreign Exchange Trading : Online Forex Master Level Trading System and Strategy
 Forex and Crypto “MORNING TRADE” Trading Strategy for Advanced Traders
 Forex Made Easy – Cynthia’s Exponential MA Forex Trading System

Took me a while, but once looked at and studied it properly, brilliant system. Added my own indicators.