Best Bollinger Bands Indicator – FREE DOWNLOAD Advanced Version of The Bollinger Bands Trading System. In essence, this is an advanced version of the Bollinger Bands. Specifically, in this indicator I have studied the movement of the price for a certain number of bars (BarsCount = 200).

For this purpose, the MA with a period of 1 was used (MAPeriod). For that matter, any MA and any number of bars could have been used for analysis. As a result, two channels will be plotted. One displays the limits where the price ranges 68% of the time for the specified number of bars. The other shows the limits where the price ranges 95% of the time for the specified number of bars.
The Sigma Bands with the default parameters is almost identical to the Bollinger Bands with the same period, equal to BarsCount. But this version has the ability to plot Bollinger Bands not only with any period by changing the BarsCount,but also to plot is based on the selected MA type with any period.
Supported MA types:
- Simple MA
- Exponential MA
- Smoothed MA
- Linear-weighted MA
Prices that can be used for plotting the channel:
- Close price
- Open price
- The maximum price for the period (High)
- The minimum price for the period (Low)
- Median price (high + low)/2,
- Typical price (high + low + close)/3
- Weighted close price (high + low + close + close)/4
All these settings are not available for the standard Bollinger Bands.
By learning how to determine the limits where any indicator or price ranges most of the time, I eneded up with making an example of calculating the standard deviation and Sigma implemented as this indicator.
Its formulas can now be adapted for any indicator you like. Sometimes, interesting results can be obtained for indicators that are plotted in separate windows, for example, the RSI, TVI or others.
Recommendations:
The difference between conventional Bollinger Bands and Sigma Bands can be seen only when using non-default settings and MAPeriod > 1.
Settings:
int MAPeriod = 1; // MA Period
int BarsCount = 200; // Bars for calculating the deviation (Sigma)
int TypeBandsMA = 0; // Type of MA for Bands
int TypePriceMA = 0; // Applied price of MA
color MAColor = clrNONE; // MA color
The analyzed MA is colorless by default. If you want to see it, set a color in the MAColor parameter.
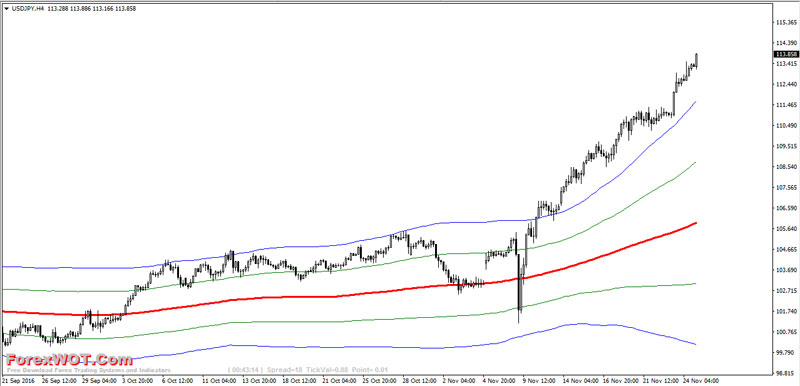
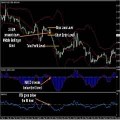
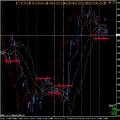
Advanced Version of The Bollinger Bands Trading Rules
- BUY ONLY Condition : When price above red mindle line
- STRONG BUY Condition : When price above green line
- SELL ONLY Condition : When Price below red midle line
- STRONG SELL Condition : When Price below green line
 TOP 10 Best Bollinger Bands Forex Trading System and Strategy
 FREE DOWNLOAD Top 10 Forex Currency Trading Systems With Bollinger Bands Indicator
 Forex Forbi EMA-Bollinger Moderate Swing and Trend Trading Strategy
 Forex Bollinger Bands Price Action Trading System and Strategy
 Best Results MACD – Bollinger Bands Forex Trading System and Indicators
 Forex Bollinger Bands Trading System with 4 Time Frame Gann Hilo Indicator (GANN)
 RSI Momentum Secret Method Forex Trading System – Step by Step Tutorial
 How to Trade Forex Bollinger Bands with Zigzag and Commodity Channel Index (CCI) in Forex
 A Simple Heiken Ashi Ma Forex Indicator
 Forex Day Trading – Secrets Bollinger Bands Forex Trading System Reveal
