Forex trading strategy that actually works – The majority of retail traders struggle to find out the best trading system and how to be consistently profitable in Forex.

This article discusses “Heiken Ashi ADX System“, one of the easiest trend reversal trading systems.
Many people had good success with Heiken Ashi and ADX strategy.
If you follow all the trade rules of this “Heiken Ashi ADX System“, you can achieve success and consistent profits.
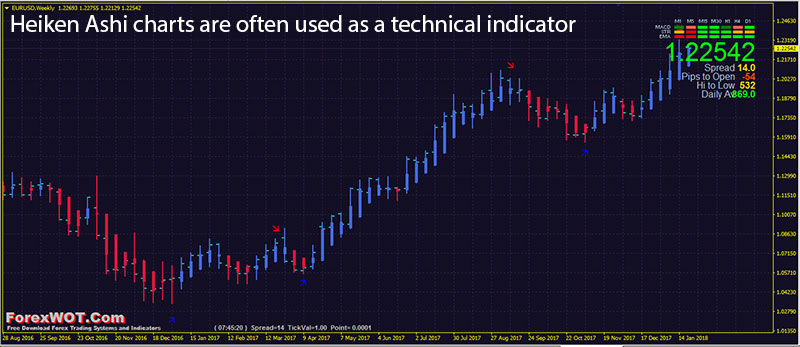
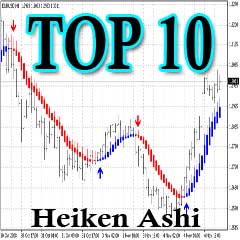
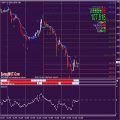
Heikin Ashi (HA) charts are similar to candlestick charts in that the color of the candlestick denotes the direction the price is moving.
The main difference between candlestick and Heikin Ashi charts is that the HA charts average price moves, creating a smoother appearance.
Because the HA price bars are averaged, they don’t show the exact open and close prices for a particular time period.
For this reason, Heikin Ashi charts are often used as a technical indicator–in addition to a typical candlestick chart–to help highlight the current trend.
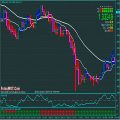
Take a look at the image below.
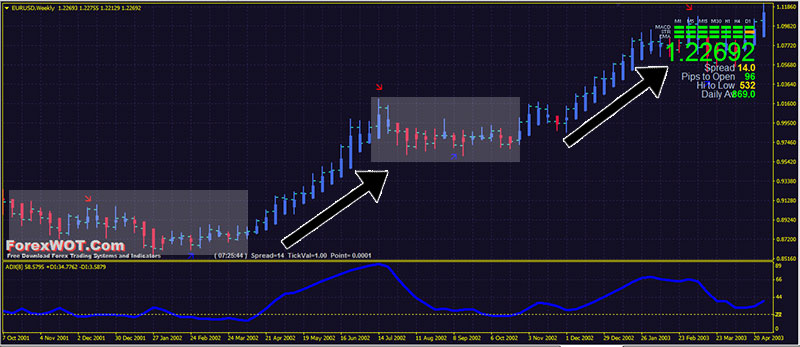
Trend detection is one of the main functions of this type of charting style.
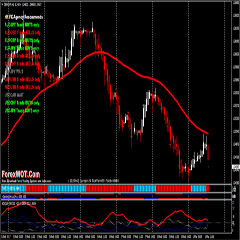
The Average Directional Index, or ADX for short, is another example of an oscillator.
It fluctuates from 0 to 100, with readings below 20 indicating a weak trend and readings above 50 signaling a strong trend.
Unlike the stochastic, ADX doesn’t determine whether the trend is BULLISH or BEARISH. Rather, it merely measures the strength of the current trend.
Because of that, ADX is typically used to identify whether the market is ranging or starting a new trend.
Take a look at the image below.
If there’s one problem with using ADX, it’s that it doesn’t exactly tell you whether it’s a BUY or a SELL.
What it does tell you is whether it’d be okay to jump in an ongoing trend or not.
Once ADX starts dropping, it could mean that the uptrend or downtrend is starting to weaken and that it might be a good time to lock in profits.
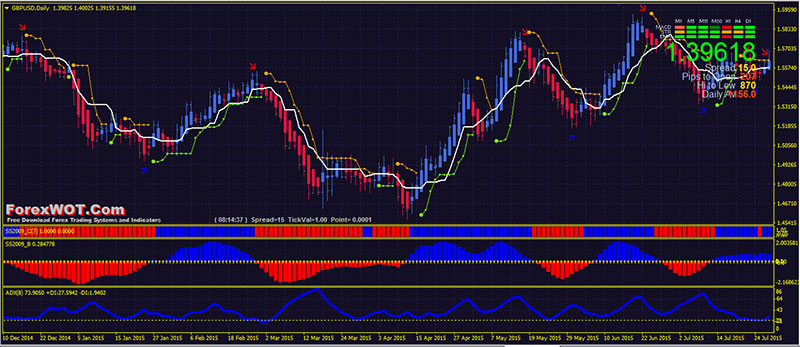
This strategy is based on trading trend reversals.
It requires you to be very patient and calm as confirmed setups are few, but when there is a confirmed set up it will be very profitable most of the time.
- Best Time Frames:
- M15 and H1 for intraday trading
- H4, D1, and W1 for swing trading
- Most Recommended Currency Pairs:
- EURUSD, GBPUSD, USDJPY, GBPJPY, and EURJPY
- Heiken Ashi DM
- Average Directional Movement Index
- SHI Silver Trend Alert
- Ichimoku Kinko Hyo
- BBands Stops
- Signal Trend
- SS2009 C
- SS2009 B
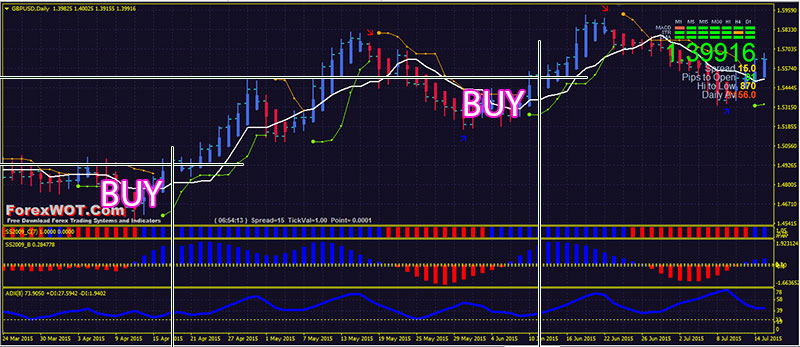
- Heiken Ashi DM blue color candles
- Average Directional Movement Index (ADX) line upward above 23 level
- Price upward and above the Tenkan-Sen Ichimoku Kinko Hyo line
- BBands Stops green color line
- SHI Silver Trend Alert green arrow
- Signal Trend green color
- SS2009 C blue color
- SS2009 B blue color
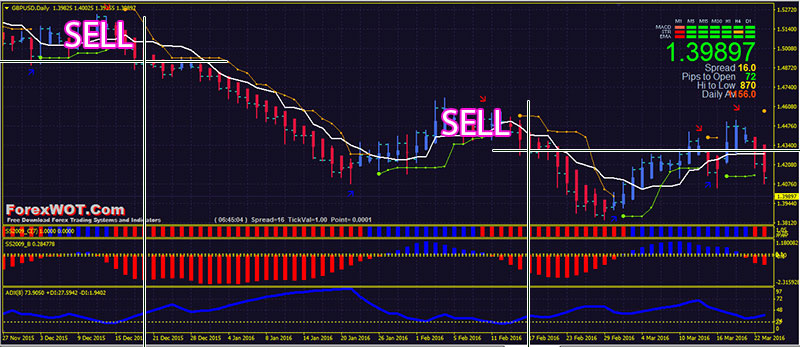
- Heiken Ashi DM red color candles
- Average Directional Movement Index (ADX) line upward above 23 level
- Price downward and below the Tenkan-Sen Ichimoku Kinko Hyo line
- BBands Stops red color line
- SHI Silver Trend Alert red arrow
- Signal Trend red color
- SS2009 C red color
- SS2009 B red color
Benefits of using Heiken Ashi:
- The Heiken Ashi chart helps a trader to catch a bigger trend rather than a small price move.
- The candles put emphasis on persistent tendencies rather than small fluctuations.
- Since the Heiken Ashi show naked trends, they can easily be pursued with a Trailing Stop order.
There are two important aspects to keep in mind on a Heiken Ashi chart:
- Bearish Trends – They are created almost exclusively by bearish candles. Strong bearish trends tend to have no upper shadows in the candles.
- Bullish Trends – They are created almost exclusively by bullish candles. Strong bullish trends tend to have no lower shadows in the candles.
 Top 10 Super Effective High Profits Forex Heiken Ashi Trading System and Strategy
 How Do I Become a Good and Prifitable Forex Trader
 Top 10 Forex ADX Trading System (High Accuracy ADX System)
 ZMA Heiken Ashi System – Easy Way To Identify The Direction Of The Trend
 Super Effective Follow Trend Trading with Heiken Ashi Profit Supreme
 Forex Trading Course – How To Trade Foreign Exchange Market With TREND SQUEEZER Heiken Ashi Trading System
 Best Forex Trading Strategy Based on The ADX Currency Strength Indicator (ADX)
 Learn Online Forex Trading – How To Easily Trade Forex With Heiken Ashi
 Forex Currency Trading – Advanced Forex ADX Moving Average Trading System With MACD and Stochastic Zone Indicator
 Forex Success Trading in Super Simple Steps
