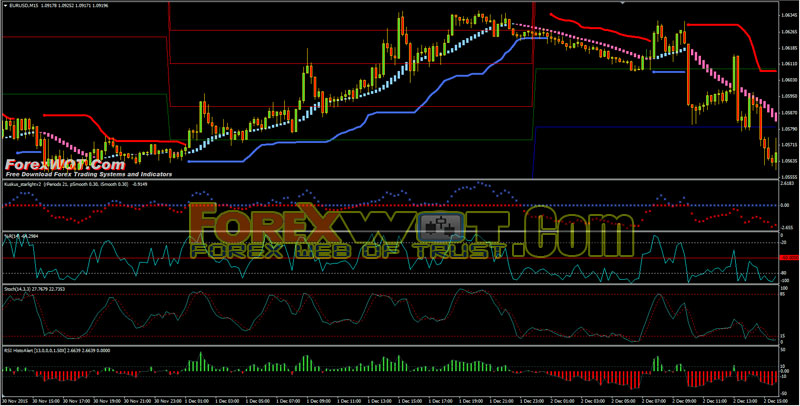
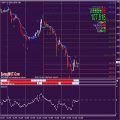
High Profits Forex Trading System and Strategy – This Forex Kuskus Heiken Ashi Moving Average Trading System is a trend-momentum forex strategy because it is composed of trend indicators and momentum indicators.

Best Time Frame: 15 min or higher.
Currency pair: any.
Forex Kuskus Heiken Ashi Moving Average Indicators:
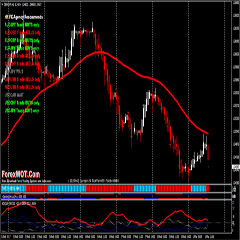
- Bollinger Bands Stop indicator (15, 2);
- RSI histo Indicator (14 period) + 2 levels (+12, -12);
- William’s percent range (14 Period);
- Starlight indicator (rperiods 21, p.smooth 0.30, ismooth 0.30);
- Hama (Heiken Ashi Moving Average) pad V.2 (3 ,21,3) optional;
- Stochastic indicator (14,3,3,);
- Pivot Points Daily.
The main indicators in this trading system are Kuskus, HAMA, and RSI Histo. The relative strength index (RSI) is a technical indicator used in the analysis of financial markets. It is intended to chart the current and historical strength or weakness of a stock or market based on the closing prices of a recent trading period. The indicator should not be confused with relative strength.
The RSI is classified as a momentum oscillator, measuring the velocity and magnitude of directional price movements. Momentum is the rate of the rise or fall in price. The RSI computes momentum as the ratio of higher closes to lower closes: stocks or currency which have had more or stronger positive changes have a higher RSI than stocks or currency which have had more or stronger negative changes.
The RSI is most typically used on a 14-day timeframe, measured on a scale from 0 to 100, with high and low levels marked at 70 and 30, respectively. Shorter or longer timeframes are used for alternately shorter or longer outlooks. More extreme high and low levels—80 and 20, or 90 and 10—occur less frequently but indicate stronger momentum. But in this RSI Histo we use 10 and -10 level to catch trend.
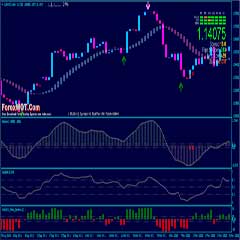
- Bollinger Bands Stop indicator blue dots;
- RSI Histo indicator (14) >+10;
- William’s percet range > -50;
- Starlight indicator >0
- Stochastic indicator <0,85 this is the most important condition.

- Bollinger Bands Stop indicator red dots;
- RSI Histo indicator (14) <-12;
- William’s percet range < -50;
- Starlight indicator <0
- Stochastic indicator >0,15 this is the most important condition.

Exit position is discretionary. Initial Stop loss on the previous swing.
 Top 10 Super Effective High Profits Forex Heiken Ashi Trading System and Strategy
 FREE DOWNLOAD 20+ Best Forex MACD-Moving Average Trading System
 FREE DOWNLOAD Top 10+ Best Forex Trading Systems for Beginners
 Forex Forbi EMA-Bollinger Moderate Swing and Trend Trading Strategy
 ZMA Heiken Ashi System – Easy Way To Identify The Direction Of The Trend
 Super Effective Follow Trend Trading with Heiken Ashi Profit Supreme
 Top 10 High Accuracy Forex Stochastic Trading Strategy
 Forex Trading Course – How To Trade Foreign Exchange Market With TREND SQUEEZER Heiken Ashi Trading System
 Learn Online Forex Trading – How To Easily Trade Forex With Heiken Ashi
 How to Become Good Forex Trader with HAMA Color RSI Histo Trading System and Strategy
