HMA Forex Indicator or The Hull Moving Average (HMA) is an extremely fast and smooth Moving Average that almost eliminates lag altogether and manages to improve smoothing at the same time. For that, Alan wrote an equation for the calculation of this Moving Average like this:

LWMA[square root(period), (2*LWMA(period/2, price)-LWMA(period, price)]
With this clever equation, Alan got a very fast Moving Average that it is much more reactive to the price action.
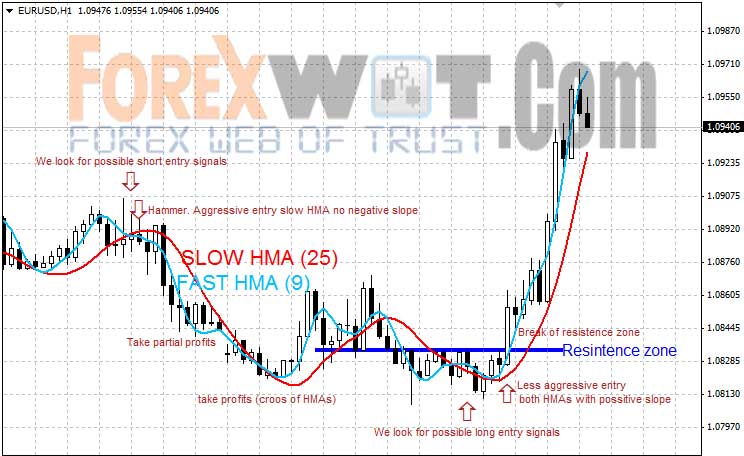
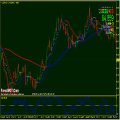
- Using only one HMA: When the HMA change its slope, this is a good time to be ready for entry long or short depending of the direction of the slope change. Always look for a good setup, like candlestick pattern or breakout of support-resistance zone.
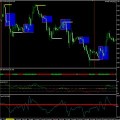
- Using two HMAs: with the typical cross of averages, e.g. HMA(9) and HMA(25). Considering the same that is said above. Also you can use it like out signal when it changes its slope (when you use only one HMA or when you use two with the change in the slope of the fast HMA). Like all moving averages, it does not work well in range markets because it gives many false entries.
I have made the code so you can change the type of Moving Average used in the calculations (but this already would not be a real Hull Moving Average) and the applied price. I like to use the typical price to take into account what has happened in each candle.


In the code, in the part “Custom indicator initialization function”, you will see the line:
SetIndexStyle(0,DRAW_NONE);
If you write DRAW_LINE, you will see another line on the chart that represent this part of the equation:
2*LWMA(period/2, price)-LWMA(period, price)
This is the calculation previous to the HMA calculus, but without the smoothing effect of applying a Moving Average to a Moving Average. You can use these lines like the use of two HMAs of different periods.
Since then the HMA has found its way into charting programs around the world and is regularly discussed on traders bulletin boards in different languages around the world. It was the result of an intellectual curiosity which I placed into the public domain by writing the following article.
The Hull Moving Average solves the age old dilemma of making a moving average more responsive to current price activity whilst maintaining curve smoothness. In fact the HMA almost eliminates lag altogether and manages to improve smoothing at the same time.
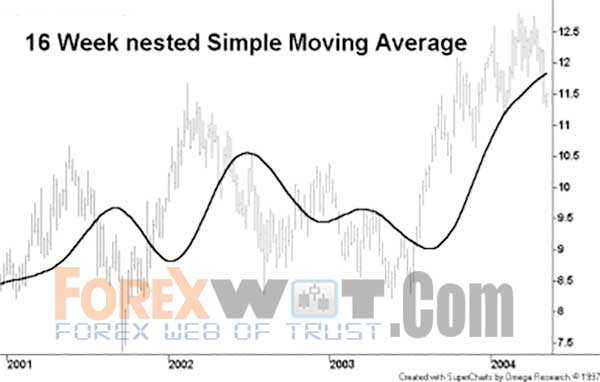
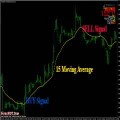
To understand how it achieves both of these opposing outcomes simultaneously we need to start with an easily understood frame of reference. The following chart contains a 16 week simple moving average which constantly lags the price activity and has poor smoothness.

Firstly, solving the problem of curve smoothing can be done by taking an average of the average.
- i.e. 16 period SMA(16 period SMA(Price))
The bad news is that it causes a huge increase in lag as seen below.
Solving the problem of lag is a bit more involved and requires an explanation with numbers rather than charts. Consider a series of 10 numbers from ‘0’ to ‘9’ inclusive and imagine that they are successive price points on a chart with 9 being the most recent price point at the right hand leading edge.
If we take the 10 period simple average of these numbers then, not surprisingly, we will determine the midpoint of 4.5 which significantly lags behind the most recent price point of 9. Here’s the clever bit, first let’s halve the period of the average to 5 and apply it to the most recent numbers of 5, 6, 7, 8 and 9, the result being the midpoint of 7.
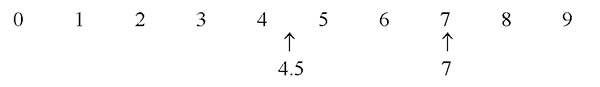
Finally, to remove the lag we take the midpoint of 7 and add the difference between the two averages which equals 2.5 (7 – 4.5). This gives a final answer of 9.5 (7 + 2.5) which is a slight overcompensation. But this overcompensation is very handy because it offsets the lagging effect of the nested averaging.
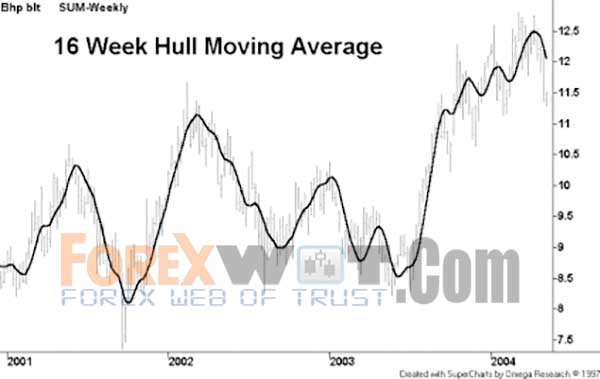
Hence the result of combining these 2 techniques is a near perfect balance between lag reduction and curve smoothing. The HMA manages to keep up with rapid changes in price activity whilst having superior smoothing over an SMA of the same period.
The HMA employs weighted moving averages and dampens the smoothing effect (and resulting lag) by using the square root of the period instead of the actual period itself, as seen below.
The following formula for the Hull Moving Average (HMA) is for MetaStock but can be easily adapted for use with other charting programs that are capable of custom indicator construction.
Hull Moving Average (HMA) formula
Integer(SquareRoot(Period)) WMA [2 x Integer(Period/2) WMA(Price) – Period WMA(Price)]
MetaStock formula
period:=Input(“period”,1,200,20);
sqrtperiod:=Sqrt(period);
Mov(2*Mov(C,period/2,W) – Mov(C,period,W),LastValue(sqrtperiod),W);
A simple application for the HMA, given its superior smoothing, would be to employ the turning points as entry/exit signals. However it shouldn’t be used to generate crossover signals as this technique relies on lag.
 Forex Multiple Moving Average : Discover How to Make 600 Pips a Month Consistently
 Hull Moving Average Daily Time Frame Trading System for Maximum Profit Potential
 FREE DOWNLOAD 20+ Best Forex MACD-Moving Average Trading System
 FREE DOWNLOAD Top 10 Super High Profits Moving Average Forex Trading System
 How to Become a Successful Forex Trader with Hull Moving Average Trading System (HMA)
 Foreign Exchange Currency Trading & Investment Strategy – Forex Z 20 System for Successful and Highly Profitable Forex Trader
 Most Accurate Forex MegaTrend Strategy : HULL Moving Average BUY-SELL Signals Trading System
 Swing Trading vs. Day Trading – How To Become A Profitable Trader with Super Signals Channel System
 The Essence of Moving Averages: What Every Successful Forex Trader Should Know
 MA COBRA Forex & Stocks Trading Strategy (Extremely Low Risk High Reward Trading Strategy) (COBRA SYSTEM)
