Forex CCI Trading System – How to Analyse Forex Market Trend with Coloured Woodies CCI Trend Following Strategy. By doing this trading system you’ll avoid many of the false signals that the indicator (all indicators) generates. Here’s how the “Coloured Woodies CCI Trend Following Strategy” works, and how to use it for trading.

How to Trade with the CCI Indicator – The main problem with just looking at overbought and oversold levels is that the trend is not considered. Consider a strong uptrend; during a strong
Consider a strong uptrend; during a strong uptrend, you will get lots over overbought readings because the price is climbing, continually moving above the historic average price.
Yet, if you go short (buy puts) based on the overbought reading, you’re fighting the trend. The price may pull back temporarily, but the trend will often resume and you’ll likely be left with a string of losing trades.
Instead, use the indicator in conjunction with the trend.
- Watch for oversold readings during an overall uptrend to signal a potential buying (call) opportunity.
- Watch for overbought readings during an overall downtrend to signal a potential shorting (put) opportunity.
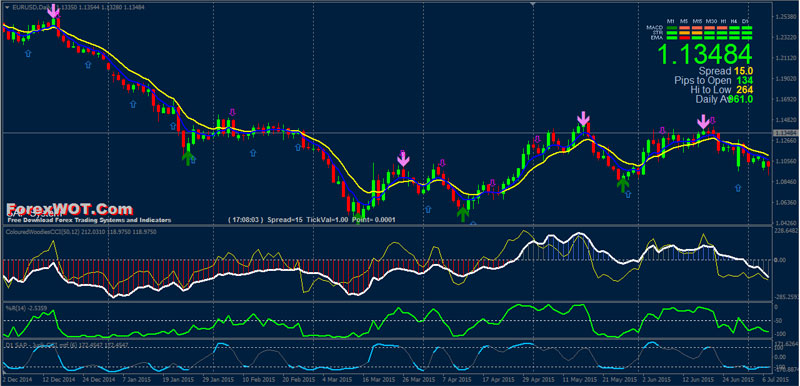
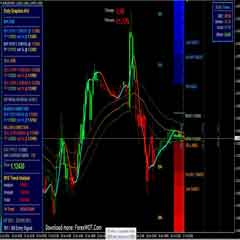
Forex Coloured Woodies CCI Trend Following Strategy is a trend following trading system based on the Coloured Woodies CCI and SAP Jurik CCI.
- Best Timeframes: H1, H4, and Daily
- Recommended Currency pair: EUR/USD GBP/USD, AUD/USD, USD/CHF, and all major pairs.
Coloured Woodies CCI Trading System is designed to generate high accuracy BUY and SELL signals from a combination of currently available indicators for the MetaTrader 4 (MT4) platform.
- Coloured Woodies CCI indicator
- SAP Jurik CCI
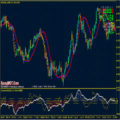
- William’s Percent Range
- Signal Trend
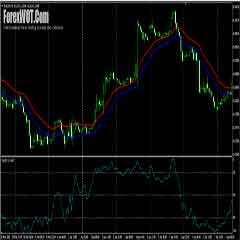
- Exponential Moving Average
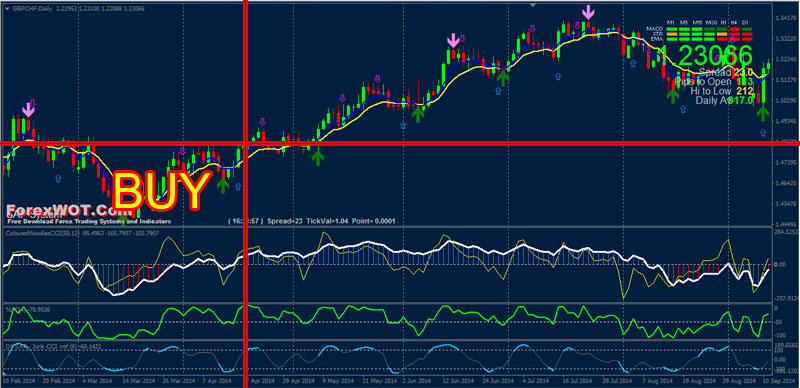
- Coloured Woodies CCI indicator uptrend (above 0 level)
- SAP Jurik CCI uptrend (blue small up arrow)
- OBOS green color up arrow
- William’s Percent Range uptrend and above -50 level
- Signal Trend green bars
- 5 Exponential Moving Average upward above 10 EMA
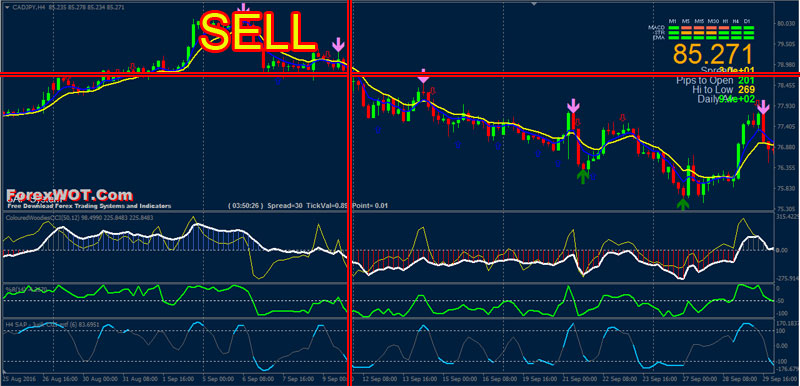
- Coloured Woodies CCI indicator downtrend (below 0 level)
- SAP Jurik CCI downtrend (red small down arrow)
- OBOS magenta color down arrow
- William’s Percent Range downtrend and below -50 level
- Signal Trend red bars
- 5 Exponential Moving Average downward below 10 EMA
- For BUY if Coloured CCI Woodie is >0 to go for PT2 (optional)
- For SELL if Coloured CCI Woodie is <0 to go for PT2. 8optional)
- Initial stop loss at previous swing, after 25 pips in gain move stop loss at the entry price
- When the price reached the pt 1 move stop loss at the + 18 pips
 How to Identify Real and Strong Trends : Forex Coloured Woodies CCI Stoch Tape Trading System Filtered with Tenkan-Sen EMA Trend
 Forex and Crypto “MORNING TRADE” Trading Strategy for Advanced Traders
 FREE DOWNLOAD 20+ Best Forex MACD-Moving Average Trading System
 Best Forex & Stocks Trading Strategy with Dolly-Graphics System
 2 MACD Effortless Forex & Stocks Swing Trading Strategy
 Forex 100Pips Momentum Trading with Coloured Woodies CCI Filter
 Advanced Moving Average Forex Trading Tutorial – How To Become A Successful Forex Trader With Moving Average Indicator
 FREE DOWNLOAD Top 10+ Best Forex Trading Systems for Beginners
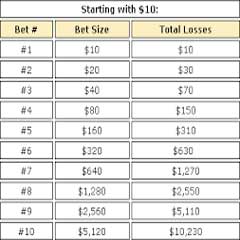 Top 5 Best Easy Forex Martingale Trading System and Signals
 Top Best 10 Automated Forex System Based With The Great Combination of Most Useful MT4 Indicators
