Measuring Forex Reversal Breakouts – Forex trading a reversal breakout undoubtedly sounds very appetizing to many traders who are lured to it by the prospect of attaining easy big profits in little time.

Who doesn’t like to get a reserved seat at the turnaround of a trend as the ride gets propelled by a frenzied momentum…?
However, things are certainly not as simple as they may seem on the surface.
First of all, how do you know if a breakout is going to reverse the current trend…?
To get some clues as to whether a trend could be reversing, you should scrutinize the currency price charts, and look out for certain reversal chart patterns that tend to serve as harbingers of a trend change.
Examples of such patterns include the head-and-shoulders, double top/bottom, triple top/bottom and so on.
If you do spot these formations in your charts especially in the daily or weekly chart, there is a high chance that a reversal may be in the works and that you should get ready for trading a breakout.
In addition to these chart patterns, you can also make use of momentum indicators to tell you if a trend is nearing its end.
Momentum indicators, also known as oscillators, often lead price actions, and they help to alert traders to turning points such as a trend reversal breakout.
MACD is one of the simplest yet most dependable indicators available in the toolbox of a trader.
MACD consists of three exponential moving averages, even though only two lines appear on the chart.
The MACD line itself is the difference between a currency pair’s 12-period and 26-period exponential moving averages (EMA).
Usually, a signal line made up of a 9-period EMA of the MACD line is plotted together with MACD.
A BULLISH signal is given when the MACD line crosses above its signal line, and a bearish signal occurs when the MACD line crosses below its signal line.
A better visual representation of MACD was invented by Thomas Aspray in the form of a MACD histogram, which is made up of a series of vertical lines.
The histogram simply represents the difference between the MACD line and its signal line and is plotted around the zero line.
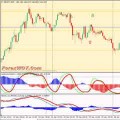
The histogram is positive (above zero line) when the MACD line is above its signal line and is negative (below zero line) when the MACD line is below its signal line (See Figure Below).
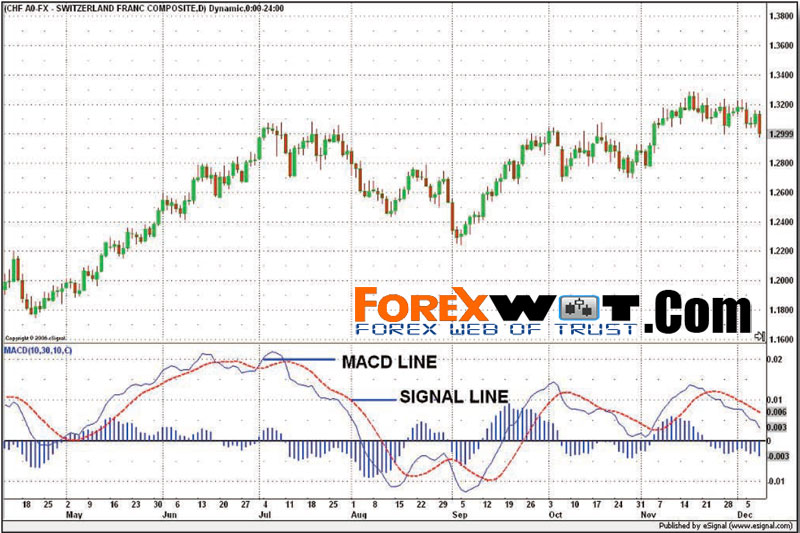
Note: the MACD indicator in the lower section of the chart window, directly below the price chart section. You can see that the histogram rises above the zero line when MACD line lies above the signal line, and goes below the zero line when MACD line moves below the signal line.
The MACD histogram tracks the speed of the price movement and reflects the speed by the way it slopes.
For example, if a price move accelerates with an upside breakout to a level higher as buyers are in a frenzy to buy the currency, then other buyers will be eager to join in as they anticipate a continuation of the rally at the same time that many people who have shorted are being stopped out, pushing the rally higher.
Under such circumstances, the histogram should become bigger (each line becoming longer than the previous line) as the speed of the price movement accelerates in a quick rally.
On the other hand, when the price movement decelerates, the histogram should contract (each line becoming shorter than the previous line) accordingly.
The reverse is true for a downside breakout.
If you want to detect a trend reversal breakout, there is a way you can exploit this momentum feature of MACD, and that is through MACD divergence signals.
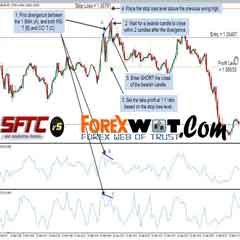
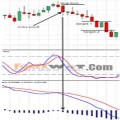
When a currency pair rallies to a new high, or moves sideways, but the MACD histogram declines, then a bearish divergence is formed (see Figure Below).
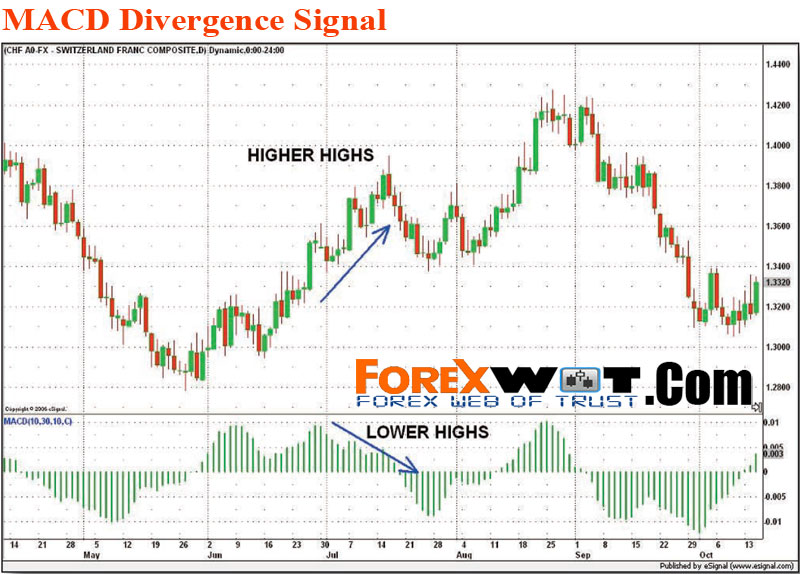
Although USD/CHF made new highs on the daily chart, the MACD histogram did not and, instead, declined lower, shrinking the histogram in the process. This bearish divergence signalled that momentum was decreasing despite USD/CHF making new highs, and gave a strong clue that a price reversal could be in place. In the following few days after the new high in USD/CHF, the pair declined by about 400 pips.
The bearish divergence in MACD mostly takes place above the zero line because prior upward price movement would have resulted in MACD moving into positive territory.
A bullish divergence in MACD results when a currency pair declines to a new low or moves sideways, but the MACD histogram slopes up higher instead of sloping lower.
Hence, when you spot a potential breakout scenario on a currency price chart, you should also take note of how the MACD histogram is performing.
If the currency has been making new highs, as the MACD histogram been doing the same by forming higher peaks…?
If so, you can assume that the uptrend is still in place, and perhaps any breakout to the downside would be short-lived or probably false.
However, if the MACD histogram shows a bearish divergence, then you will have a strong signal that a downside breakout is more likely to be sustained than false.
The reverse applies to a bullish divergence.
Although a MACD divergence signal seldom occurs, it is generally a very strong reliable signal when it does make an appearance.
Another momentum indicator that can help you anticipate rather than react to price changes especially when prices are on the verge of breaking out is the RSI.
The RSI measures the relative changes between higher and lower closing prices over a given time period and provides an indication of overbought and oversold conditions.
This is the formula for RSI:
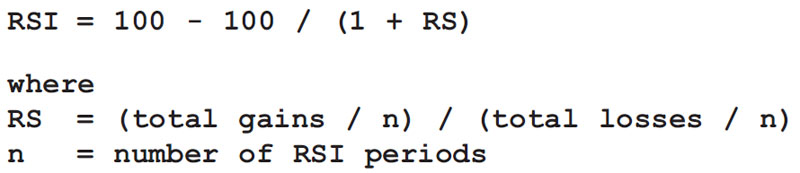
A reading of 30 or below indicates that the currency pair is in an oversold condition, and a reading of 70 or above indicates that the currency pair is in an overbought condition.
However, it is not so useful to use this overbought/oversold condition for gauging the outlook of a potential breakout on the currency price chart as momentum indicators do not work as well during trending phases.
An uptrend could register a prolonged period of overbought conditions, whereas a downtrend could register a prolonged period of oversold conditions (See Figure Below).

A period of downtrend on the daily chart of USD/JPY corresponds to a threeweek oversold condition in RSI. Traders who bought USD/JPY seeing that it was oversold possibly ended up with losses as USD/JPY stayed in the oversold territory for three weeks.
The most useful way of applying the RSI is through its divergence signals.
When divergence starts to appear after a directional move, it strongly indicates that a turning point of the current trend is near, and can help you gauge reversal price breakouts.
Like MACD, a bullish divergence occurs when a currency pair declines to a new low, but the RSI makes a higher low.
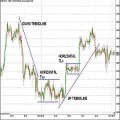
A bearish divergence is simply the opposite – a currency pair rallies to a new high, but RSI makes a lower high instead (see Figure Below).
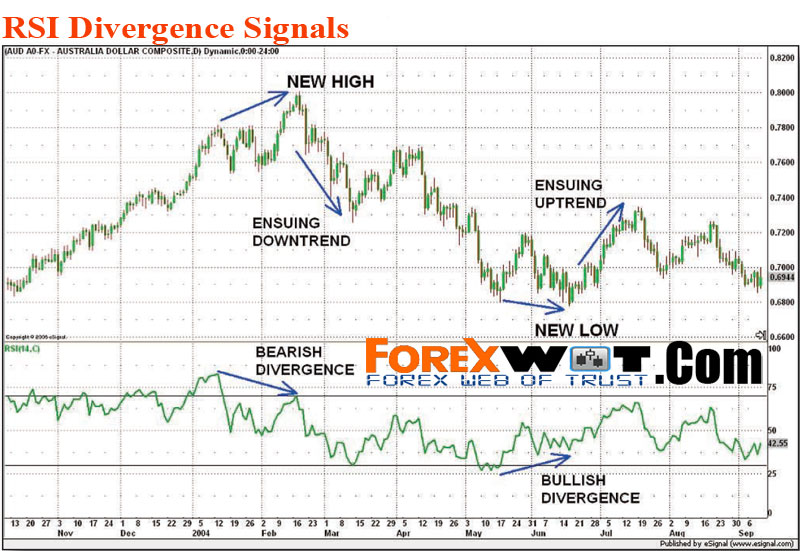
Examples of a bearish divergence and a bullish divergence are shown on this daily chart of AUD/USD. As you can see, being able to identify RSI divergence can help you prepare for a high probability trend reversal.
As you can tell from the RSI’s calculation, the average up closes for a period is divided by the average down closes over the same period.
This is how a bearish divergence may take place: In an uptrend, a currency pair will advance to higher highs, and result in more average up closes compared to the down closes.
Both the price and the RSI will then reach a peak reflecting this.
Usually, after an advance, the currency pair tends to take a break and consolidate for a while before deciding
the next move.
Currency prices may retrace slightly or move sideways during this time.
This decline or sideways move in prices will cause the RSI to slope downward from its peak since the number of times the currency pair is up in price divided by the number of times the currency pair is down in price decreases.
When the currency pair later tests or moves slightly higher than its previous high, the RSI will form a lower peak this time compared to its previous peak, since the RSI formula takes into consideration the period of decline and consolidation.
This lower peak may signal that the bulls are not as strong as they seem to be, and they could be running out of buying power if no new bulls enter the market.
This bearish divergence warns of a potential trend reversal ahead, and if the currency pair is close to touching a support level, a breakout to the downside is more likely to be sustained and successful than short-lived and false.
The opposite situation is true for a bullish divergence.
For the Breakout Trading Strategy, using momentum indicators like MACD or the RSI can sometimes provide clues to internal trend weakness since momentum precedes price change.
While it may be impossible to predict with 100% accuracy the success of a breakout, as well as the length and duration of the subsequent breakout move, you can make use of these momentum tools to alert you to the possibility of a significant reaction or even a trend reversal breakout of the currency pair.
 2 MACD Effortless Forex & Stocks Swing Trading Strategy
 FOREX 1 MIN Scalping Trading Tricks By The Most Successful Forex Trader
 FREE DOWNLOAD 20+ Best Forex MACD-Moving Average Trading System
 Works on All Time Frame Forex MACD Divergence Trading System and Strategy (MACD)
 5 Minute Chart Surefire RSI-CCI Forex Trading System and Strategy
 10 Very Easy and Accurate FOREX MACD Trading System
 Forex Profit Booster Trading Strategy – Most of The Time it Doesn’t Give False Signals
 How to Do Accurate Forex Trend Line Analysis
 Automated Forex Trading System – 80% Accurate Forex Scalping System Strategy With MACD And Stochastic Indicator
 Forex Trading Training : How to Use MACD Divergence Profitable Forex Strategy In 4 Easy Steps
