High Profits Forex Heiken Ashi Laguerre Trading System and Strategy – Heikin-Ashi chart looks like the candlestick chart, but the method of calculation and plotting of the candles on the Heikin-Ashi chart is different from the candlestick chart.

In candlestick charts, each candlestick shows four different prices: Open, Close, High and Low price. Every single candlestick is independent from others and has no relation with the previous or next candlestick.
On the opposite, Heikin-Ashi candles are calculated and plotted using some information from the previous candle:
- Open price: the open price in a Heikin-Ashi candle is the average of the open and close of the previous candle. [Open (previous bar) + Close (previous bar)]/2
- Close price: the close price in a Heikin-Ashi candle is the average of open, close, high and low prices. (Open+High+Low+Close)/4
- High price: the high price in a Heikin-Ashi candle is chosen from one of the high, open and close price of which has the highest value. Max (High,Open,Close)
- Low price: the low price in a Heikin-Ashi candle is chosen from one of the high, open and close price of which has the lowest value. Min (Low,Open, Close)
So the candles of Heikin-Ashi chart are related to each other because the open price of each candle should be calculated using the previous candle close and open prices, and also the high and low price of each candle is affected by the previous candle.
That’s why a Heikin-Ashi chart is slower than a candlestick chart and its signals are delayed.
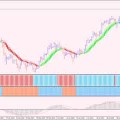
When plotting this type of chart it provides a little bit of lag but not near the lag as in a moving average as shown in the thumbnail. Thus, it gets you in the trade quickly and keeps you in just until the trend reverses. Lets look at the simple trade set up and follow through:
- The trigger is having two same colored bars in the same direction.
- The exit is when you have one colored bar in the opposite direction.
If you noticed in the normal 5 minute chart following the same period you would have had several false stop signals. Using different time frames you may use this to help guide you on the trade trigger or help you stay in a trade longer to let your profits runs. Experiment and let us know how you have done …
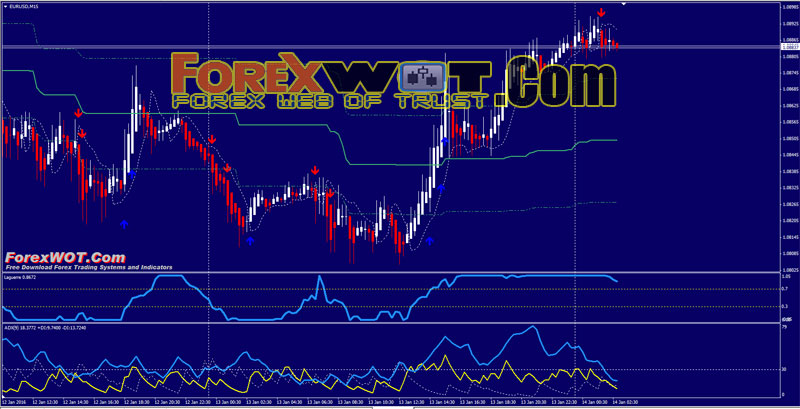
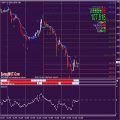
Forex Trading with Heiken Ashi Laguerre Trading System and Strategy is a trend following forex strategy based on the Heiken Ashi, Laguerre indicator, and SSL.
Best Time Frame : 15 min.
Currency pair : EUR/USD, GBP/USD, or major depends by the spread.
- Delta Trend
- Lagurre 0.75 (level 0.3 and 0.7);
- SSL (Lb 5);
- Heiken Ashi;
- Daily BS Bands
- ADX
- Delta trend buy arrow;
- Laguerre indicator> 0.7;
- Price above SSL;
- Heiken Ashi green;
- ADX upward above 30 line.

- Delta trend sell arrow;
- Laguerre indicator< 0.3;
- Price below SSL;
- Heiken Ashi red;
- ADX upward above 30 line.

profit target EUR/USD 7 pips, GBP/USD 9 pips.
Initial Stop loss 12-15 pips.
BREAKING DOWN ‘Heikin-Ashi Technique’
The Heikin-Ashi technique is used by technical traders to identify a given trend more easily. Hollow candles with no lower shadows are used to signal a strong uptrend, while filled candles with no higher shadow are used to identify a strong downtrend.
Forex Trading with Heiken Ashi Laguerre Trading System and Strategy provide a technical trader the information needed to make a profitable trade.
 20 Halloween Costumes From Amazon All Traders will Actually Want To Wear
 Top 10 Super Effective High Profits Forex Heiken Ashi Trading System and Strategy
 FREE DOWNLOAD 20+ Best Forex MACD-Moving Average Trading System
 Forex HABBS RSI Filter Trading System for Serious Day Traders
 2 MACD Effortless Forex & Stocks Swing Trading Strategy
 Forex and Crypto “MORNING TRADE” Trading Strategy for Advanced Traders
 MA COBRA Forex & Stocks Trading Strategy (Extremely Low Risk High Reward Trading Strategy) (COBRA SYSTEM)
 Advanced Trend Trading With Smoothed Heiken Ashi Candlesticks
 Super Effective Follow Trend Trading with Heiken Ashi Profit Supreme
 TOP10 BEST Full Time Forex Trader Trading System and Strategy
