LST Forex Trading System. How to Use MACD Moving Average Convergence-Divergence. The LST is the FIRST trading strategy based on a combination of divergence analysis and statistical concepts.


It includes my proprietary automated divergence recognition system, following specific conditions and analysis methodology (this indicator was made possible thanks to my partner Laszlo Hun and the team of specialists he leads).
In addition, LST includes the candle patterns indicator, price tunnel indicator that will help us to identify ideal areas for entries and exits, and an execution scripts that will make entries easy & fast, while automatically calculating the risk/reward for you.
The LST was created to provide a solution for traders who are looking for statistical trading (more on that later). During the last period I’ve been asked by many to share a good proven strategy that trades divergences on any time frame and any pair. Well, that was quite easy for me since all I do for trading my live account is divergences.
Once you’ve installed the system to your computer, please open the MetaTrader platform you installed it to.
Go to the chart, right click on the chart area, and choose the LST template.
That’s how your chart will look like:

You can see at the bottom that there is an indicator that automatically identifies divergences for you. You don’t need to search for divergences; it will do it for you!
Green divergence line means this is a bullish divergence and we look for an up move, Red divergence line means it is bearish divergence and we expect a down move.
As you see, the indicator has 4 colors. Light green and dark green, light red and dark red. When the slope changes, the color changes.
When the histogram is above the zero line and the slope is going up, the color is dark green and when it’s above zero line but the slope is going down the color is light green.
For the bearish situation – when the histogram is below the zero and the close is going down, it is dark red, but when the slope is going up it becomes light red.

On the chart itself you will get divergences. There are 4 colors as well for divergence but at this point ALL you need to understand is what a bullish divergence is and what a bearish divergence is. This is what I’m about to explain now:
Bullish divergence is a situation when price create lower lows on the chart, but the indicator creates higher lows. When it happens, the indicator will show you the lines on the chart and the indicator.

Bearish divergence is a situation when the marker (the prices) creates higher highs on the chart and the indicator shows lower highs. When it happens, the indicator will show you the lines on the chart and the indicator.

So, what are we looking for when a divergence appears?
If a bearish divergence appears we will look for sell opportunities.
If a bullish divergence appears we will look for buy opportunities.
So once the divergence is there, the system is looking for a candle pattern to be created. The candle pattern that we use here are: hammer, inverted hammer, Marabuzo, engulfing.
You might wonder why these specific patterns? The answer is that statistically I found that they are the most reliable with this kind of trading.
Here are some examples of how the chart looks like when a pattern appears:

What you will see on the chart is a pattern (marked with a colored square) and you will get a message telling you the direction of the alert (Buy in this example), the pattern name (Hammer in our case) and the date and the time the candle was identified.
More examples of alerts:


So, after understanding how the signal looks like, let’s explain how we get a signal.
The system is based on divergence, candle pattern and extreme area. The first condition the system checks is that there is a divergence.
Once a divergence has been identified, the system is looking for certain candle patterns. The system automatically detects when such candle patterns appear.
When this condition has been met as well, the last condition that needs to be satisfied, for this signal to be valid, is that prices have reached an extreme area.
Don’t worry; you don’t need to look for any “extremes”. We built it automatically so the system is looking for a hidden parameter that checks for extreme situations. (hidden = the LST will look for it, but will not mark it on the chart).
ONLY when all 3 conditions will be confirmed you will get a signal.
Why do I say: “ONLY when all 3 conditions will be confirmed you will get a signal”?
Because it is possible that you will see a divergence with candle pattern and WON’T get an alert. It will be because these are still not the market conditions we are looking for to trade!
So when all 3 conditions are met we have a signal.
When you get a signal, you will see an arrow that shows the expected market direction. Red arrow above the candle pattern means look to sell, green arrow below the candle pattern means look to buy.
Examples:
Bearish signal – we look to sell:

Bullish signal – we look to buy:

Once we got the signal, a price tunnel will appear on the chart. Now, let’s explain about the price tunnel.
The price tunnel is there to show us the best potential profit area for our trade. This tunnel will be different from trade to trade and it depends on market volatility and strength. The more volatile the market is the deeper the tunnel is.
Please note that we can use both lines as potential targets and I will elaborate about it and explain the differences later when we come to the trading rules.
Ok, so now you understand how the system finds signals for you and what does it is based on. Now it is time to understand how to trade the system and how to profit. What to do and what NOT to do, and how to maximize your profits.
Trading the LST is simple, even very simple. But to make it really profitable for you, you have to understand what you are.
So the first thing we will learn will be the entry rules.
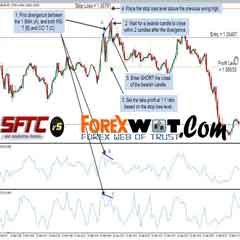
1- Wait for a signal. Don’t enter if you don’t get a divergence + candle pattern + extreme area. Once you have a signal you have to apply the “human eye rule” for confirmation, as I will explain now.
2- The Human Eye rule. If you have a signal to sell, you MUST confirm it by a resistance, meaning – you always want to sell at a strong resistance area. You can find the resistance on the same chart or better on one time frame higher than the one you got the signal on (For example, if you got a signal on 5 min chart, look for a resistance on 5 min chart or even better at 15 min chart.)
If you get a signal to buy, look for support level on the same time frame that you got a signal or one time frame higher.
Note – If you are an experienced trader, feel free to confirm via using your favorite technical tools such as Fibonacci levels, chart patterns etc…
If you are relatively new to Forex market trading, use ONLY resistances/support – that’s REALLY ENOUGH!). Of course it will not filter 100% of the “bad” trades, but by confirming a divergence with a resistance/support we confirm that the market reached an important area and a retrace might happen.

We can see we have a buy signal so we have to confirm by support area. Looking back we can see that there is a strong support area, so our entry is good. Here is what happened after that:

Our target was reached.
3- Set the stop loss level – That’s pretty much the simplest thing All you have to do is to set the SL few pips above the last high, if you got a bearish candle pattern and looking to sell. And if you got a bullish pattern and are looking to buy, set the SL few pips below the last low.
Examples:


4- Take profit– This is a little more complicated, so please make sure you read it carefully and understand the notes. Once we get a signal, we automatically get a price tunnel on the chart.
This tunnel is different from trade to trade and is based on market volatility and strength. As a default, our final target is the second dotted line of the tunnel, the line that’s furthest from the current price. But as I just said, it is a default take profit.
As you know, the market is dynamic. We can set a take profit and let the market work, but I always prefer to manage the trade and to “listen” to what the market tells to me.
This strategy is all about statistics. Means, our goal is to gain more than we risk, per every single trade. Our goal is to risk some amount from our balance, let’s say 1% per trade, and our goal is to take AT LEAST twice more than we risked, means – at least 2% per trade. We can also trade fixed lot sizes but I will explain later why I don’t recommend that too much.
Therefore since our goal is to take twice that we risk, our take profit level can be changed.
If you enter a trade and you have at least twice bigger profit that you risked once you reached the first dotted line, my suggestion to you is to take the profits and close the trade. Here is an example for what I mean:

As you can see in this example, the default take profit is on the further line. BUT at the first line we will be already more than 2 times bigger at profits than the stop loss we were ready to risk.
So if we reach this area, and we have a risk/reward ratio of 1 to 2 already, at least, my suggestion is to take the money if you see that the market has difficulties there at this area.
Let’s see what happened right after the signal:

As you can see, once the price reached the first dotted line the profit we got was already twice bigger than the stop loss we risked. We can see that this area turned to be a stiff support as well and holds the prices several times.
In such situations, I recommend not to fight the market, and take you money. You already got your risk/reward you are looking for, so don’t fight the market and take your profits.
There will be several conditions on the market where we can close the trade earlier than 1 to 2 risk/reward, but I will elaborate about all of them later.
 2 MACD Effortless Forex & Stocks Swing Trading Strategy
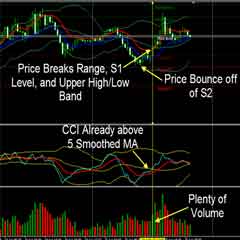
 5 Minute Chart Surefire RSI-CCI Forex Trading System and Strategy
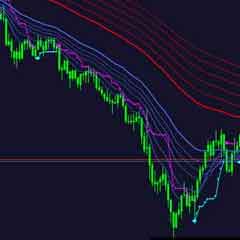
 MA COBRA Forex & Stocks Trading Strategy (Extremely Low Risk High Reward Trading Strategy) (COBRA SYSTEM)
 Learn Forex Trading Online – Profitable Trade Use EMA and CCI Forex Trading System
 Best Forex Trading Software and System For Divergence Pattern Analysis
 MACD RSI Trading – The Easiest Way To Measure Forex Reversal Breakouts
 Forex Profit Fusion – Learn How To Profit Foreign Exchange Markets in 30 Minute Time Frame
 Foreign Exchange Trading : Online Forex Master Level Trading System and Strategy
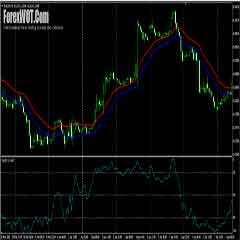 Advanced Moving Average Forex Trading Tutorial – How To Become A Successful Forex Trader With Moving Average Indicator
 Forex Made Easy – Cynthia’s Exponential MA Forex Trading System
