Using Moving Averages as trend filters – First, I am going to assume that most readers have a basic understanding of moving averages.

Even so, understanding the differences between an exponential moving average (EMA) and a simple moving average (SMA) is an area I find many people are unclear about.
So with that in mind, let me begin with a brief explanation of how a simple moving average is drawn.

Figure 1
In the days before computers, technicians simply added the closing prices for a given period (let’s say 10 days) and divide that number by 10.
In this example, we would require at least 10 days of data to begin plotting this particular moving average.
To continue plotting the line, we would add days 2 through 11 and so on.
If price rises, then the slope of the line would follow suit, indicating an uptrend.
See Also
- High Profits Advanced Forex Smoothed Moving Average (SMMA ) Trading System
- Forex Trend-Catcher Trading Strategy With Moving Average and MACD Custom Indicator
- Simple Powerful and Effective Forex Price Action Trading Strategy Using Moving Average
With the advent of computers, technical analysts went to work enhancing this old classic moving average.
In an effort to reduce the lag associated with the simple moving average, they began using a different calculation that placed more weighting on the most recent prices when compared to older prices.
The result was the creation of the exponential moving average.
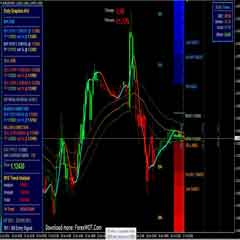
In the chart labeled Figure 1, I have applied both a 50-day simple moving average and exponential moving average to the daily TF (E-mini Russell 2K).
Note that the distance between actual prices is far less for the exponential moving average than it is for its slower counterpart.
Keep in mind that moving averages are most useful in a trending environment, so one must recognize that using this tool in range-bound markets will not yield great results.
When it comes to the settings to be used, this will be predicated on various factors.
The timeframe and financial instrument play an important role in the selection of the length of the moving average is used.
Case in point, institutional traders keep a close eye on the 50 and 200-day simple moving averages as a measure of whether to be long or short stocks or the market in general.
They also look at this particular technical indicator as an average mean. In the past, I have discussed at length the propensity for markets to overshoot (move away from the mean) and eventually work back to the average.
This phenomenon has even received some notable mention in technical circles of late.
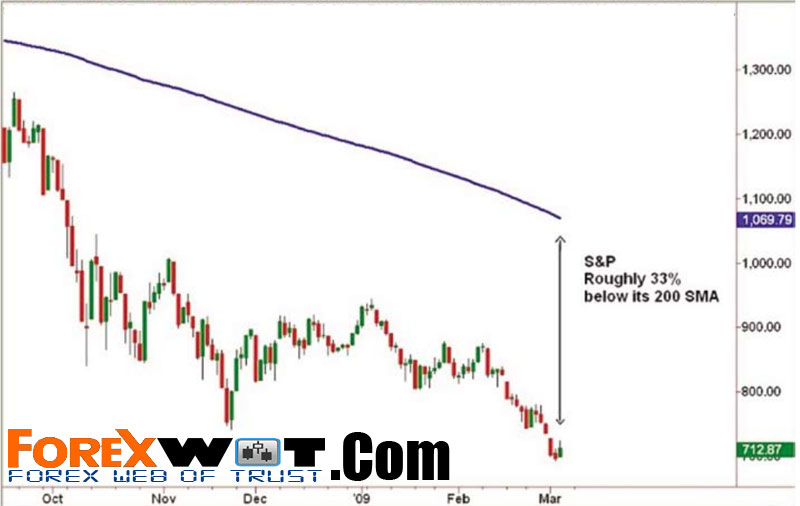
Figure 2
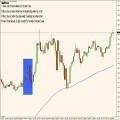
Specifically, I am referencing the fact that this week the S&P 500 traded roughly 33% below its 200-day simple moving average (see Figure 2).
This is an extremely rare incidence as it has occurred only three times in the past 50 years.
The most recent occurrence happened on November 20th of last year and it happened twice between 1927 and 1937.
On each of these occasions, a sharp rally ensued.
Whether or not this will happen again is anyone’s guess.
In times like these where most precedents are being shattered, nothing is surprising anymore.
My use of moving averages is large as filters.
That is to say, depending on where price is located relative to the moving average, I will look to trade in the same direction.

Figure 3
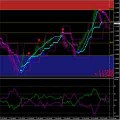
The chart in Figure 3 illustrates how the moving averages provide a filter signaling us to look only for shorting opportunities, as price never closes above either moving average.
The short sales would be done at the highlighted resistance areas.
In addition, notice there are two moving averages on the chart. The faster one (red) can be used to exit steeper trends and the slower (blue) moving average can be used as a resistance level to confirm the trend.
In this depiction, the slow moving average is a 60-period exponential moving average and the fast moving average is a 25-period exponential moving average plotted on a 5-minute chart.
These particular settings work well on this futures contract.
As I have stated before, one has to try different setting to find ones that work best for the specific stock, Forex pair or futures contract that is being traded.
The best way to determine whether a specific setting is optimal is by visual observation of a trending pattern and assessing how price reacts to the particular length being applied.
As you can see in the previous chart, price tends to be attracted to the moving averages.
One last observation regarding moving averages – although most traders are told that the trend is their friend, take notice that when the price has moved a considerable distance away from the slow moving average, the reward to trade in the direction of the prevailing trade has appreciably lessened.
Therefore, it is best to wait for a retracement or take countertrend trades when this occurs.
As with any technical indicator, moving averages should not be used standalone.
There should be rules attached to their utilization in order to compliment setups and, they should be tested to add a level of confidence before they are implemented.
 How Do I Become a Good and Prifitable Forex Trader
 Foreign Exchange Currency Trading & Investment Strategy – Forex Z 20 System for Successful and Highly Profitable Forex Trader
 High Accuracy Volty Channel Stop RSI Trading Strategy and How to Win Consistently in Forex Trading
 High Probability Trading: The 10 Pips Forex Trading Strategy
 Forex SAS System and Indicators – Making Money in Forex Capital Markets is Easy
 Trade Without RISK – Test Your ForexWOT Trading Systems NOW…!!!
 Best Forex & Stocks Trading Strategy with Dolly-Graphics System
 Forex Bill Williams Market Facilitation Index (BW MFI) Multi Trend Trading System and Strategy
 Sure Forex Breakout System Absolutely Amazing and Easy Forex Strategy
 Forex Advanced Breakout Trend Easy and Simple System for Trading Success
