The Ichimoku Cloud consists of several components which give it a unique capacity to detect trends, determine whether we are in a trend, the direction and the when the trend reverses. One of the components is the Kumo/Cloud which is one of the most unique aspects of the Kumo.

Using the Kumo, there is a great strategy to detect key reversals using the Kumo Break Strategy. Before we can look at this strategy, we must first look at the components of the Kumo.
The Kumo Components
The Kumo has two main lines referred to as Senkou Span A/leading span 1 and Senkou Span B/leading span 2. In this article, we refer them to as Span A and Span B respectively. The field or shading between these two lines is what we call the Kumo/Cloud.
Span A is created through adding the Tenkan Line to the Kijun Line, then finding their average and plotting it 26 time periods ahead. The formula is: (Tenkan Line + Kijun Line)/ 2 plotted 26 periods ahead.
Span B is formed by adding the highest high (over the last 52 periods) to the corresponding lowest low, then finding their average and plotting the result 26 periods ahead. The formula is: (Highest high + lowest low over the last 52 periods)/2 and placed 26 periods ahead.
The use of the Kumo
The Kumo is typically looked at in terms of support and resistance; if it is thick, then the support/resistance is strong (depending on the position of price in relation to the cloud). By contrast, if it is thin, then the S/R levels are considered weak.
Generally, if the price is above the Kumo, then there is an uptrend in place and/or more buying opportunities. If the price is below the Kumo, then it is under resistance and it is better to be looking for shorts instead of longs.
The longer price action stays above or below the Kumo, the stronger the trend and the more support/resistance the Kumo offers. The Kumo can be very effective for option traders as well as the trend/momentum traders. This is because price will stay on one side of the Kumo during a trend. The farther the price action is from it, the stronger the trend and more volatile it is.
How can we use it for Reversals?
If the price is clearly above or below it, then when price action breaks the kumo, it can often signal a reversal. There are several factors which increase the chances of a reversal, such as:
- The thickness of the Kumo when broken
- The amount of time price action has been on one side of it
- How far price action has moved before touching/breaking the Kumo
- The time frame
- These factors are crucial when analysing to determine whether a Kumo break is signalling a reversal or not.
Examples
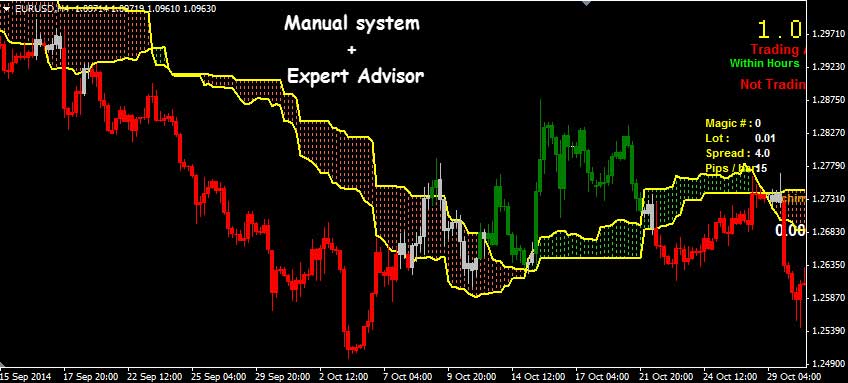
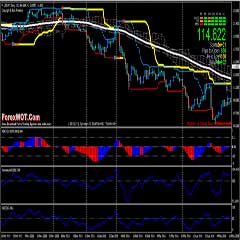
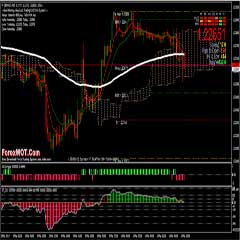
Consider the EURUSD chart below. The price was below the cloud for a long period on the left side of the chart and sold off massively. After a couple of attempts on the daily chart, the price broke above the cloud.
We know that the cloud represents support and resistance; hence, the pair breaking above it, then coming back to it again to treat it as support presented a great reversal opportunity, which you can see in the middle of the chart. After retouching the cloud, it went on a 3000+pip run.

Ichimoku Forex Trading System Conclusion
The Kumo Break method is one of the main systems applied by the Ichimoku traders for detecting key reversals. By using the kumo, we can qualify the current reversal, which provides traders with a unique opportunity to either take profits on current positions, or take a new reversal setup.
It is effective in timing trends, reversals and trading strategic reversals when all the elements are in place. Its ability to measure support and resistance enables the Ichimoku to also provide traders with a unique perspective on the markets.
Nevertheless, there are other major elements required to trade the Kumo Breaks with precision. We have analyzed Kumo breaks on Forex, Futures, Commodities and Indices over the last 10 years. With our proprietary indicators and analytical programs, we are able to give precise measurements of how far and long a Kumo break should travel which gives you a precision edge when trading them.
Ichimoku Forex Trading System and EA
Put these in the Indicator folder

Put these in the Experts folder

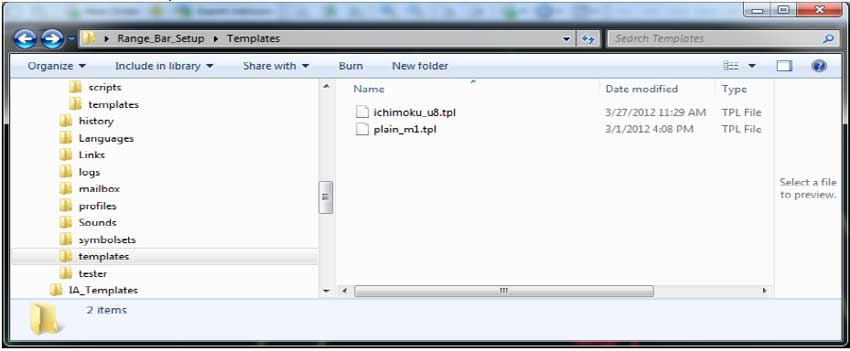
Put these in the Templates folder
- Open chart of desired pair.
- Set to M1 time frame.
- Attach “Plain_M1” template.
- Hold down “Page Up” key until chart stops updating. Then turn scrolling back on.

- Attach “RangeBars“EA to this chart and upas shown.


- Under file menu select “Open Offline” and find the off line chart you just created.

- Double click it to open it.

- Attach the “ichimoku_u8” template.
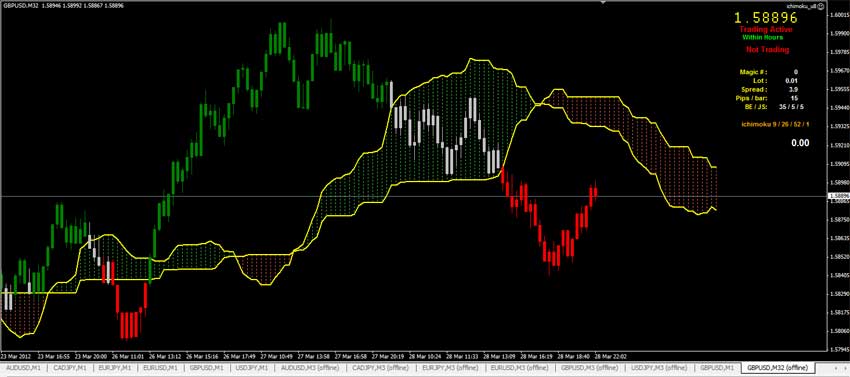
- Set the EA settings to what you want.
Ichimoku is a trading system that originated in Japan. Developed by journalist Goichi Hosoda, it is designed to help traders identify and trade with the dominant trend. The lines look quite complicated on the chart but they can be easily used as part of an automated trading strategy. Happy Trading…
 DOWNLOAD Top 7 Best Forex Ichimoku Trading System and Strategy
 The Turtle Channel Online Forex Currency Trading System Filtered With Ichimoku Cloud and MACD
 M15 Double Ichimoku Cloud Forex Trend Trading System with BBands Stop and 4 MTF HAS Bars Indicator (HA)
 Forex High Accuracy D1 (Daily Timeframe) : Ichimoku Cloud H4 D1 Trading System and Strategy
 IBS Reversal Ichimoku Trading System : How To Use Ichimoku Cloud To Trade Forex
 Free Forex Short Course – Forex Ichimoku Kumo Day Trading System For Baginners
 High Accuracy “H4 Time Frame” Trading Strategy Based on Ichimoku and Pallada Entry Signal
 2 MACD Effortless Forex & Stocks Swing Trading Strategy
 MA COBRA Forex & Stocks Trading Strategy (Extremely Low Risk High Reward Trading Strategy) (COBRA SYSTEM)
 Forex High-Probability Ichimoku Cloud THV Trading System With Step MA Stochastic Custem Indicator

How do I get the Ichimoku ELive charts and how do I get the cloud on the live chart?
Did you get it to work on a live chart?