The purpose of this article is to explain the first steps in conducting technical analysis of forex prices.

These steps involve finding support and resistance, trend lines, and assessing where the price is in relationship to these geometric points.
Where is the currency pair price and what is it doing…?
This question is quite basic but it involves many levels of analysis.
Understanding the location of the currency pair is a foundational beginning of technical analysis and will reveal a great deal of information that a trader can use in formulating trading strategy.

But how do we know where to look…?
The basic technical measurement of horizontal support and resistance provides the ground floor of technical analysis.
Whenever you look at a currency pair, you have to ask where SUPPORT is and where RESISTANCE is.
The answers provide the first mapping of the market.
- SUPPORT is where the price stops falling,
- …and RESISTANCE is where it stops rising.
The process for locating support and resistance is fairly straightforward.
Figure 1 includes several support and resistance lines.
Those lines that form floors and ceilings are outer support and resistance containing the price action within a range.
Those lines that are inside these larger lines are inner support and resistance.
What is most significant about horizontal support and resistance lines is that they are not lagging.
In contrast to indicators, they are projections and form psychological hurdle zones.
When price establishes support or resistance, the market recognizes that location as a zone or hurdle that has to be overcome.
The immediate future price movements need to probe and penetrate a support or resistance line.
One of the first principles of trading forex is to locate a trade near support or resistance.
Once we know where horizontal support and resistance are, we need to also determine the strength of that support and resistance.
There are different ways of forming an opinion about the level of strength in the S/R lines.
In Figure 1, we can see that the 1.2500 level offers strong support because over six months that price point was unable to be broken down and the euro–U.S. dollar (EURUSD) held above it.
In contrast, the resistance levels show only one test of the previous high.
The trader can conclude that there is the greater strength on the support side at 1.25.
If the price moved toward the previous high (1.3367 on December 31) and failed to go through it, confidence that resistance was stronger at that level would increase.
The time interval on a chart also can be used to weight one’s confidence about how strong the S/R levels are.
The longer time frames such as monthly and weekly resistance and support are more robust.
After all, a great deal of money has had the chance to go through those levels but did not.

In constructing support and resistance lines, the trader needs to realize that there is a degree of judgment.
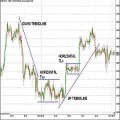
In Figure 2, the support and resistance lines are drawn where there appears to be a set of highs and lows.
Some of the candle wicks are penetrating the lines.
Those penetrations would be viewed as creating temporary levels of new support and resistance, with the stronger levels being those connecting more points.
Drawing support and resistance lines need to be done with the perspective that these are ZONES and NOT EXACT LINES.
The trend is your friend—until it is at an end.
After finding the geometry of support and resistance, we come to the most classical tool used by chartists—trend lines.
- Trend lines provide a projection of support and resistance that links past behavior into the future.
- A trend line is used to map whether there is consistency in highs and lows.
While simple in its construction, knowing the trend is a basic foundation for trading forex.
Once a trend is identified, detecting a potential change in the trend becomes a focus for the trader because trading at the break of a trend or the failure to break a trend line is a high probable point of success.
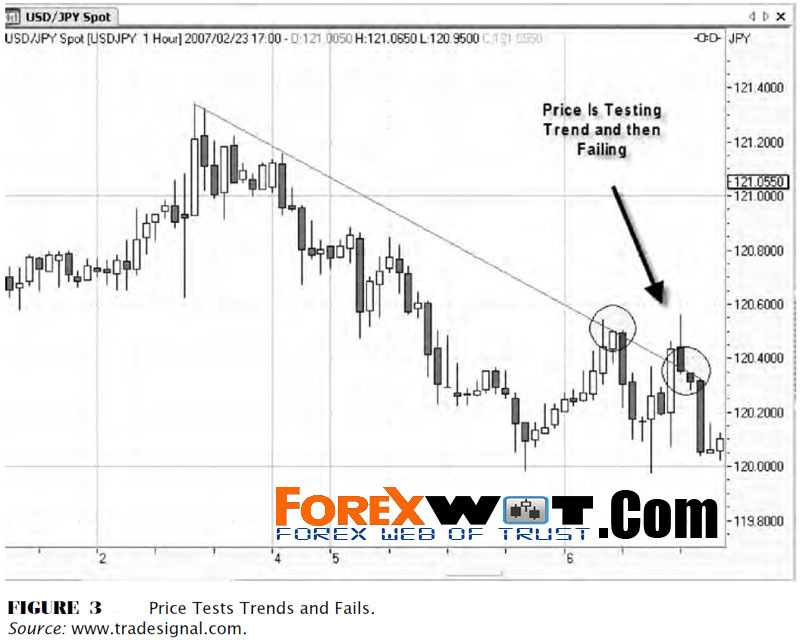
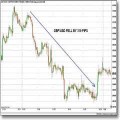
Figure 3 shows a downtrend in place and the price twice coming to the trend line and then failing to stay
above.
Although the price actually created a high above it (where the arrow points), it failed to follow with another candle at that high point.
Thereafter, the return of the price under the trend line and the resumption of the downtrend would be recognized by an experienced trader as a sell condition.
The main benefit of trading with a trend is one of the probabilities.
An upward trend presents a greater number of buying opportunities to the trader.
It doesn’t mean there are no good selling or contra trend opportunities.
We can see in the charts that there were countertrend moves, but much fewer than trend-aligned moves.
A prudent trader will seek opportunities that provide a higher probability of success.
Trading with a trend meets this condition.
The question arises: Which trend should the trader align himself with—the week trend, day trend, 4-hour trend, and so on…?
Each choice has advantages and disadvantages.
The basic trade-off is the increase in price volatility and range when a larger trend time frame is selected.
Trading in the direction of the weekly trend means that a trader will see periods of time and maybe days when the price is moving the other way, threatening losses.
But in this case, if the day trends are also moving in the same direction as the weekly trends, it represents more confidence that the trend is stable.
For intraday traders trading off a 15-minute chart, when the 15-minute trend direction is aligned with the 4-hour trend direction and also confirmed by the 5-minute trend direction, there is a high level of robustness to the trend.
The concept of three time zones confirming trading decisions will apply in many areas.
Three-line break charts are useful for detecting and confirming trend changes.
Treeline break charts are increasingly available to retail traders through their forex firms and through charting companies.
They are worth using because there is little ambiguity whether a trend is in place and also at what point it would be considered reversed.
Therefore, three-line break charts provide the ability to confirm trend direction in any time interval and project where the trend would be considered reversed!
Three-line break charts are excellent charting tools to help answer the question:
- In which direction shoulda trade to be taken, and where should I enter the trade…?
Let’s explore this chart tool and how it shows trend strength, trend stability, and trend direction.
The chart looks like a candlestick chart, but it is not.
Each block represents the completion of a new high or new low.
The chart, therefore, shows only consecutive highs or consecutive lows.
This provides a snapshot of the sentiment.
What the trader is looking for is the predominant direction of the sentiment, whether the sentiment is weakening, and (most importantly) whether it has reversed.
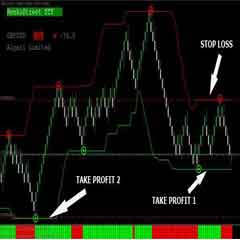
In the example in Figure 4, there are 10 blocks (or lines) down and then a reversal.
At the point where the reversal block went past the previous three down blocks, we get a reversal signal.
The trader can look to buy at that point since the market showed the ability to reverse the sentiment.
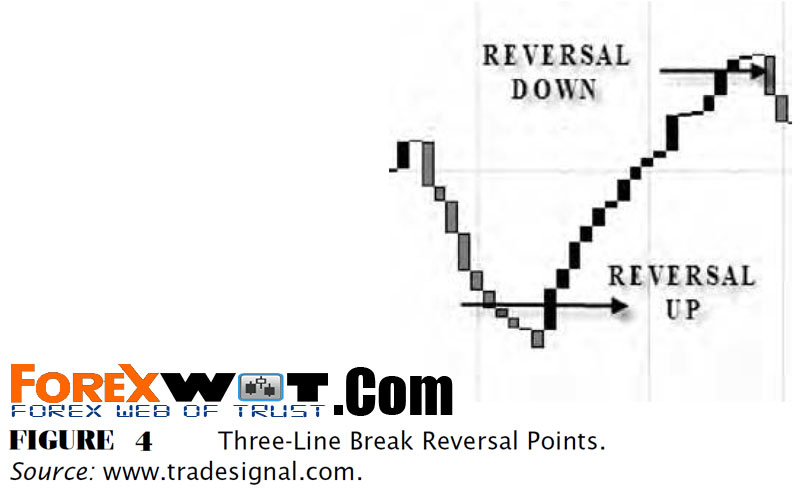
This is why it is called three-line reversal.
Similarly, move to the right of the chart and we can see that after 17 consecutive new highs, there was a reversal down.
If the trader is looking to confirm a decision to buy or sell, then the three-line break pattern is used to support that decision.
If there is an intention to buy, then the three-line break blocks should, at a minimum, show that the market is in a buying trend by showing that it is producing consecutive closes of newer highs.
The timing of the entry may be based on other setups, but it is even better if the entry to buy occurred on the three-line break reversal from a previous series of down sequences.
The decision to sell a currency pair would be confirmed by having the three-line blocks showing a down sequence, and preferably the entry would occur upon the reversal.
The trader has the challenge to select the right time frame for the three-line break charts.
Using a day chart converted to three-line break chart will show consecutive day closes of highs or lows.
This does not mean that there will not be intraday reversals of important magnitude.
It won’t show up.
As the trader selects shorter time frames, such as the 4-hour, 30-minute, and 5-minute three-line break charts, the trader will recognize the strength of the trend sentiment from a multiple time perspective.
The first important use of three-line break charts is to decide to trade with the three line break direction.
But it can be with the day, 4-hour, 30-minutes, or 5-minute directions.
If they are all aligned, it is the best of all worlds.
Using the 5-minute three-line break charts provides a short time frame but still enables the trader to detect trend direction and reversals that lead to magnitudes of 20 and more pip moves that can be captured.
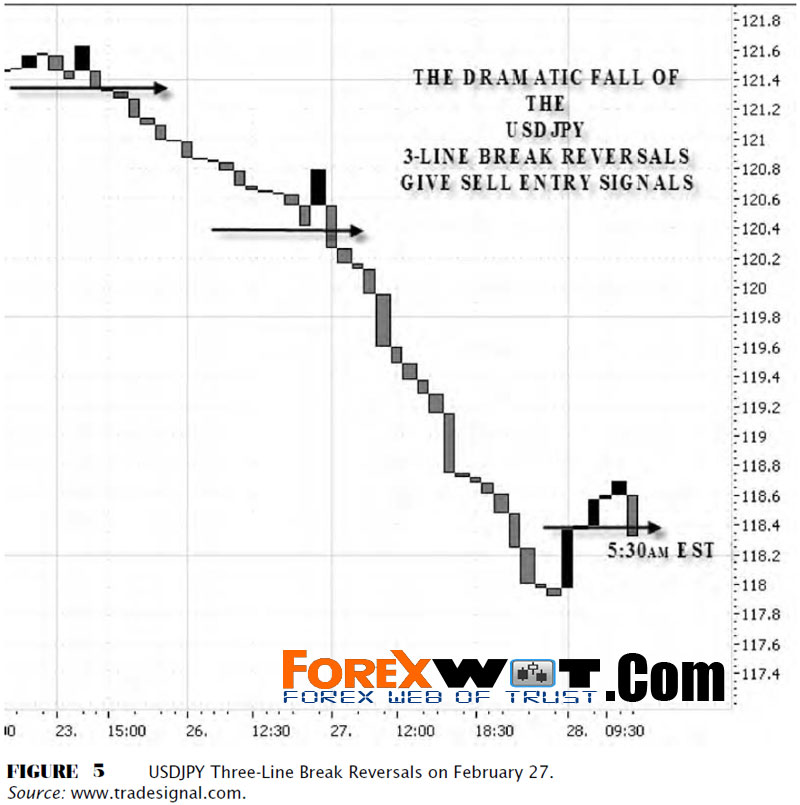
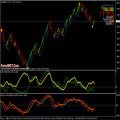
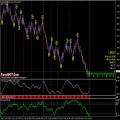
Take a look at the U.S. dollar–Japanese yen (USDJPY) 30-minute three-line break chart right before and after the February 27 sell-off that affected the world’s equity and currency markets.
We can see that by using three-line break charts, the trader would have had a first reversal at 121.4 for a sell signal.
Then the pair proceeded to close 16 new 30-minute lows consecutively before it reversed up briefly; a new reversal at 120.4 occurred, followed by 18 new lows; and then it reverted back to 118.2.
The dramatic fall of the USDJPY is seen by the three-line charts as very strong, with long sequences of selling creating new lows consistently (Figure 5).
There were very few buying opportunities.
An alert trader would be to use the three-line chart to join the sentiment ride down but would know when to get out (when it reversed up) and when to get in again (when it reversed back down).
One of the biggest mistakes traders make is to be caught on the wrong side of the market.
Three-line break charts reduce this kind of error by defining the trend in an unambiguous way.
Trading with the trend can be rephrased as trading with the three-line break trend.
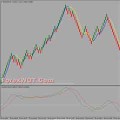
Using what you have just learned, take a look at a chart of the New Zealand dollar-U.S. dollar (NZDUSD) (Figure 6).
It is a daily chart with a three-line break in it.
We can see this pair had very nice alternative sequences of up and down trends.
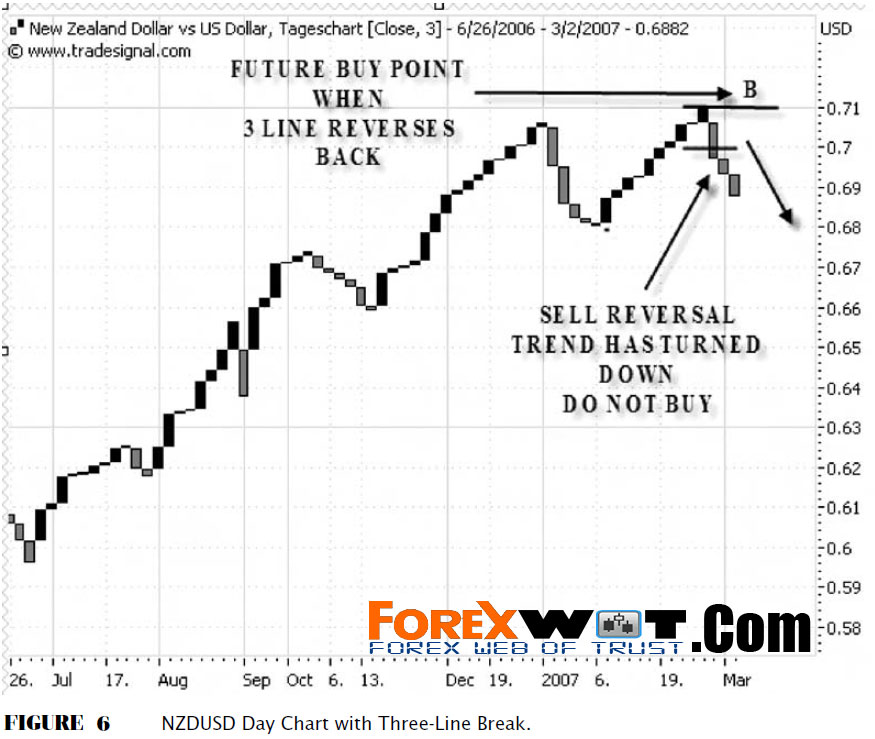
The trader who wants to buy would see that the pair is in a downtrend and that the NZDUSD has just reversed an uptrend.
The trader would want to wait for a reversal again at point B.
Finding the trend direction and points where the trend would be considered being reversed is valuable for entering trades.
But one of the largest challenges facing the forex trader is to know when sentiment has changed and turned against the trader and then get out of the way.
When it comes to detecting the earliest form of change in trend direction, the trader should consider Renko charts.
Renko means brick in Japanese and provides a way of smoothing out the noise of the market.
A Renko chart provides an ability to represent a predefined move in the price.
While each candlestick or bar provides the low, high, open, and close of a sample period,
…Renko charts provide an additional Renko block only if the price has moved and closed at the predetermined setting.
In other words, if the trader wants to know only if there is persistence in the sentiment, seeing consecutive Renko blocks would confirm that the market is showing the ability to push further brick by brick.
This is very useful,
…and we will show you how to use Renko blocks in combination with other indicators to enable precision exiting.
Figure 7 compares Renko visualization of price action and with the standard candlestick variation.
Each Renko block is set here at one pip move.
This means that if the price closes one pip higher or lower, a new block is added.
The time interval is one minute.
The trader can choose any time frame and set appropriate to his or her goals.
However, the value of Renko blocks is mostly at the smallest setting generating information to the trader about the patterns in the sentiment that are difficult to detect with other charts.
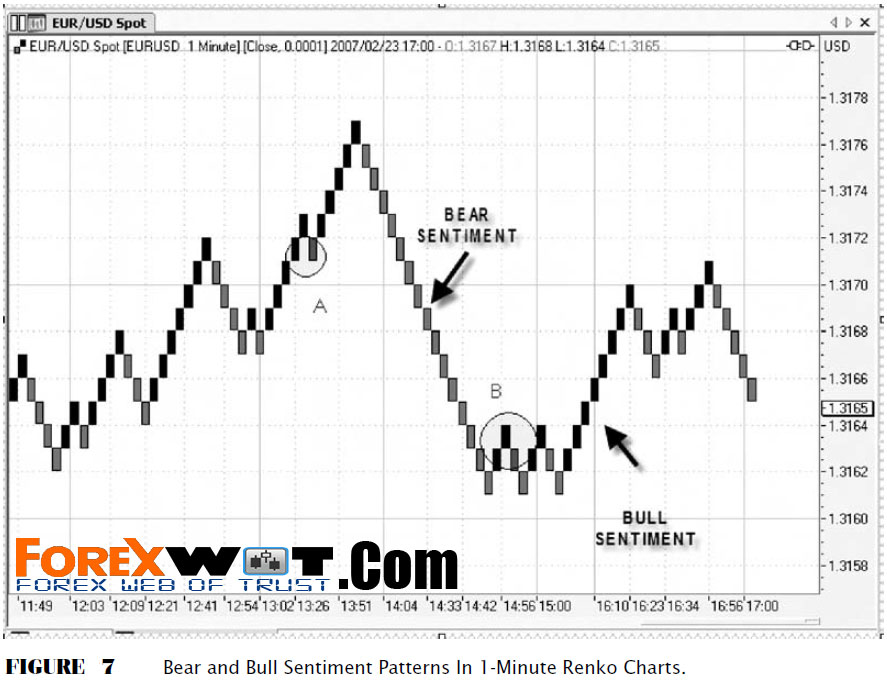
In effect, we can see that the currency pair exhibits varying degrees of patterns of sentiment.
The ability to generate a consecutive series of new up blocks or new down blocks reveals clearly whether a strong micro trend is in place.
At points A and B, we see a reversal of the pattern.
There will always be some reversals.
In this case, one or two Renko blocks should not be perceived as the end of the previous pattern.
In most recent series of blocks, at the right end, we see a downtrend.
The trader seeing this chart who was already in a sell position would interpret this last formation as permission to continue to stay in that position.
By mapping the price action along key support and resistance lines and finding trend lines, the trader creates a foundation for shaping the trade.
We can see that one can go even further by examining intraday, intra hour, and even micro-trend directions using a three-line break and Renko charts to show patterns of bull or bear bias.
The key advantage of using three-line break or Renko charts is to reveal whether the sentiment of the market has changed either at the large time frames or the smallest time frames.
It is a tool worth exploring.
 Best Forex Renko Total System and Indicators (Advanced RENKO SYSTEM)
 Top 5 Best Forex Renko Trading Systems and Strategy
 Forex & Stocks Trading Strategy with RENKO MAKER PRO System
 Simple Techniques How to Measure FOREX Market Sentiment
 How to Do Accurate Forex Trend Line Analysis
 Highly Profitable Renko Street Trading System
 How to Make Money Trading Forex Easily with Renko MACD Mirror Trading System
 Correctly Identify Forex Trend with Renko Bar Chart and Momentum Trading System
 Simple Forex Renko System – Making Money in Forex is Easy if You Know How
 How to Install, Creating, and Setting Forex Renko Chart
