

I will show you the best forex trading strategy using MACD. Forex trading strategy using MACD and a few other supporting indicators very effective to maximize profits. We will discuss all the best thing about the best forex trading strategy using MACD.
MACD and Parrabolic SAR
Currently, we are going to try and analyze a forex trading strategy using MACD Crossover indicator with indicator Parabolic SAR on the 1-hour chart’s. This is the second indicator tools technical standard that is owned by the Metatrader.
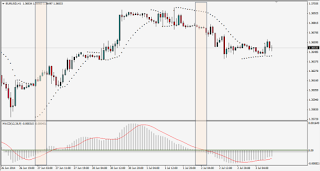
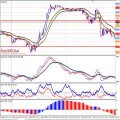
In the example graph below, the pair that will be used is the EUR/USD with a 1 hour chart’s where at the bottom of the graph, while the MACD is an indicator at the top of the graph is Parabolic SAR indicator with green dotted line.

On the chart above, there are two scenarios must be considered based on the strategies we discuss. Starting from the left side, and around 05: 00, 27 June 2014, we see the indicator MACD signal line penetrates from the ground up which indicates prices will move up, and added a few moments later indicator Parabolic SAR also will give an indication of moving up the mark with the indicator dot is below the price.
With anticipation the price will keep moving up until around noon on June 30, 2014, when dot indicator parabolic SAR is above the price that started giving signals confusing.
For this trade the MACD indicator has done a crossover on the signal line and confirmed by dot indicator parabolic SAR moves on top of the price which is the exit points that give potential gains of 70 points.
Then on July 2, 2014, seen that the indicator Parabolic SAR moves over the price on the MACD indicator with the follow moves down through the signal line and produce prices move according to the estimates of the Parabolic SAR indicator when moving under the price. The result was a profit of around 80 pips, with advantage being taken when signals from price moves back under the Parabolic SAR indicator.
Easy … right? But it should be noted that this strategy should be tried first on the demo account so we can have the right feel when we use.
MACD Divergence – Convergence
This strategy is the most basic strategy for utilizing indicator MACD crossover using signal divergence or convergence between price and indicator signal is considered essential by the technical analyst and as a result is regarded as a great opportunity when the signal is successfully identified.
The 4 hour chart’s, pair EUR/JPY
The MACD indicator managed to make the highest bar on April 4, 2014 and begin moving in downtrend around 9 June 2014. On the other hand prices continue to move higher and higher to fight even the MACD indicator consolidated into the upper side of the triangle pattern that creates a pattern of divergence with MACD.
The next indicator MACD continued to move down to penetrate the line signal on June 10, 2014, and finally the price moves downtrend and confirms the movement indicator MACD breakout moves down with the advantages of end of around 130 points if the trader opens a position close to the crossover entries.
Indeed, the divergence between price and indicator signal changes with long-term, as seen by the movement of prices in the chart above.
The action could take profit is realized when the MACD is moving up and lay it down on June 13, 2014.
The pattern of Divergence is considered the most reliable signal generated by the MACD indicator.
 2 MACD Effortless Forex & Stocks Swing Trading Strategy
 How Do I Become a Good and Prifitable Forex Trader
 FREE DOWNLOAD 20+ Best Forex MACD-Moving Average Trading System
 Foreign Exchange Currency Trading & Investment Strategy – Forex Z 20 System for Successful and Highly Profitable Forex Trader
 High Accuracy Volty Channel Stop RSI Trading Strategy and How to Win Consistently in Forex Trading
 10 Very Easy and Accurate FOREX MACD Trading System
 Best Forex & Stocks Trading Strategy with Dolly-Graphics System
 Learn Forex Trading Online – FGM MACD Profitable Forex Currency Trend Following Trading Strategy
 Forex Bill Williams Market Facilitation Index (BW MFI) Multi Trend Trading System and Strategy
 Forex Multi MACD Ichimoku Trend Trading Strategy with Moving Average and ADX Indicator (ADX)
