RSI CCI Forex Trend Trading System and Strategy – ‘Relative Strength Index – RSI’ : A technical momentum indicator that compares the magnitude of recent gains to recent losses in an attempt to determine overbought and oversold conditions of an asset. It is calculated using the following formula:

RSI = 100 – 100/(1 + RS*)
*Where RS = Average of x days’ up closes / Average of x days’ down closes.
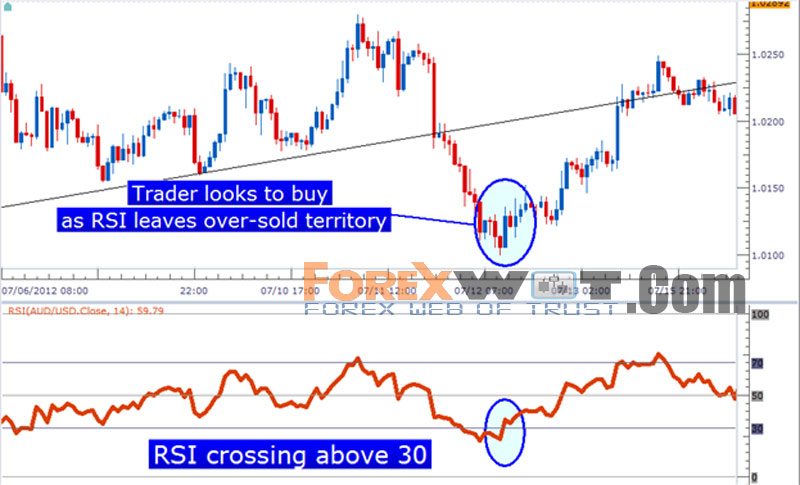
Because the indicator can show potentially over-bought or over-sold conditions, traders will often take this a step further to look for potential price reversals.
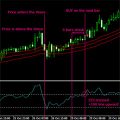
The most basic usage of RSI is looking to buy when price crosses up and over the 30 level, with the thought that price may be moving out of oversold territory with buying strength as price was previously taken too low. The picture below will illustrate further:
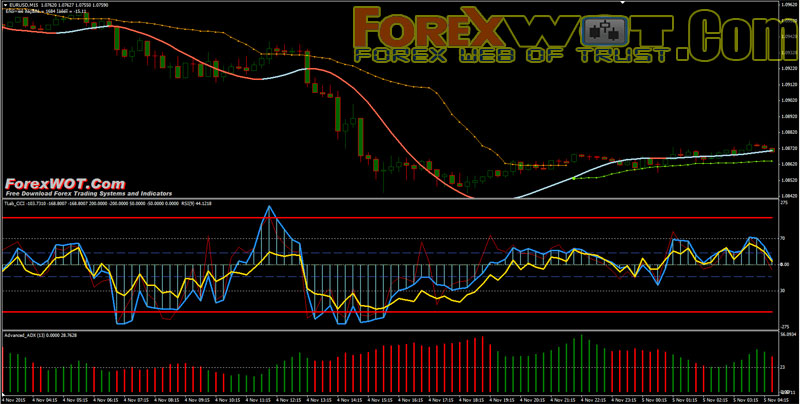
The CCI compares the current price to an average price over a period of time. The indicator fluctuates above or below zero, moving into positive or negative territory. While most values, approximately 75%, will fall between -100 and +100, about 25% of the values will fall outside this range, indicating a lot of weakness or strength in the price movement.
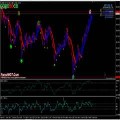
CCI Basic Strategy
A basic CCI strategy is to watch for the CCI to move above +100 to generate buy signals and move below -100 to generate sell or short trade signals. Investors may only wish to take the buy signals, exit when the sell signals occurs and then re-invest when the buy signal occurs again.

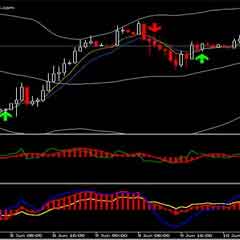
- Regression Channel UP Trend;
- Bollinger Stop up trend;
- Buy order when CCI 7 or CCI 13 Crosses upward RSI 9 or
- also when CCI 7 and CCI 13 are > RSI 9 (not recommended it’s aggressive)
- Advanced ADX green and > 23
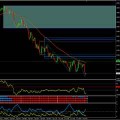
- Price below Slope Direction Line color blue

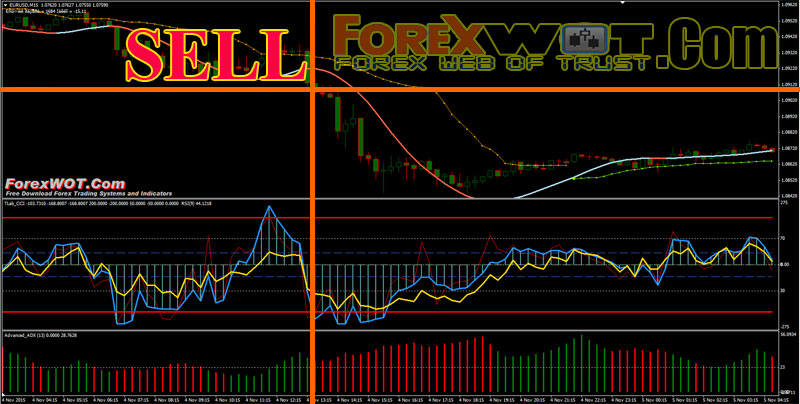
- Regression Channel down Trend;
- Bollinger Stop down trend;
- Sell order when CCI 7 or CCI 13 Crosses downward RSI 9;
- also when CCI 7 and CCI 13 are < RSI 9 (not recommended it’s aggressive)
- Advanced ADX red and > 23
- Price below Slope Direction Line color red
Note:
The CCI can be used on any market or time frame. One time frame can be used, but trading with two will provide more signals for active traders. Use the CCI on the longer-term chart to establish the dominant trend, and on the shorter-term chart to isolate pullbacks and generate trade signals. Implement a stop loss strategy to cap risk, and test the CCI strategy for profitability on your market and time frame before using.
 How Do I Become a Good and Prifitable Forex Trader
 Forex and Crypto “MORNING TRADE” Trading Strategy for Advanced Traders
 Foreign Exchange Currency Trading & Investment Strategy – Forex Z 20 System for Successful and Highly Profitable Forex Trader
 High Accuracy Volty Channel Stop RSI Trading Strategy and How to Win Consistently in Forex Trading
 Forex Breakout Trading Strategy with CCI and ADX
 5 Minute Chart Surefire RSI-CCI Forex Trading System and Strategy
 Forex Magic Breakout EMA CCI Trading – Maximize Your Profits and Achieve Exponential Earnings
 Foreign Exchange Currency Trading – Double CCI Retracement Forex Trading Method with Heiken Ashi Smoothed (HA)
 Forex Forbi EMA-Bollinger Moderate Swing and Trend Trading Strategy
 Forex Bill Williams Market Facilitation Index (BW MFI) Multi Trend Trading System and Strategy
