FREE DOWNLOAD RSI Kijun-sen Forex Trading System And Strategy – Hello all. I’m back for the second time to bring you another trading method of mine, also taken from my Ichimoku trading series.


This is actually the third of the 3 part series. Please feel free to ask questions, give your opinions and make any suggestions.
RSI Kijun-sen Forex Trading System And Strategy
Hopefully I will have more to submit in the future. My main purpose is to help other newbies (like myself) find their path in the FX world!! So, with that being said i would like to present to you…”Next Stop”!
I’m looking forward to hearing your comments!! 🙂
Indicators:
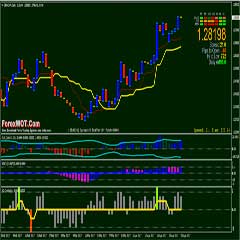
- Kijun-sen (52, shift 3)
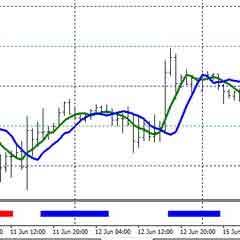
- Tenkan-sen (9, shift 0) Daily Chart Only for possible daily pullback level
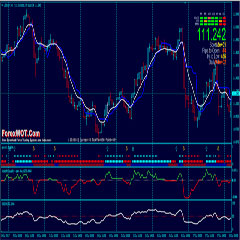
- RSI (26)
- Trend lines (S/R Levels)
Timeframes Used:
- Daily (Recognize General Trend)
- 4 Hour (Get S/R Levels, Kijun-sen Level & Intraday Trend)
- 1 Hour (Entry/Trade Management)
Daily Chart (General Trend):
- Mark the previous day’s high/low price
- If Tenkan-sen is above Kijun-sen and price is above both lines the market is in an uptrend
- If Tenkan-sen is below Kijun-sen and price is below both lines the market is in a downtrend
- If price is between Tenkan-sen and Kijun-sen the market is undecided
4 Hour Chart (Support and Resistance Levels):
- Mark all major and minor support and resistance levels from this timeframe
- If price is above 4 Hour Kijun-sen look for long entries, if price is below 4 Hour Kijun-sen look for short entries
1 Hour Chart (Entry & Trade Management):
Go LONG
- When price crosses Kijun-sen from below, closes above it and RSI is above 50.
- When price comes down, tests and rejects Kijun-sen from above and RSI is above 50.
- When price tests, rejects and forms a pin bar at a support level.
- Solar Wind Joy GREEN
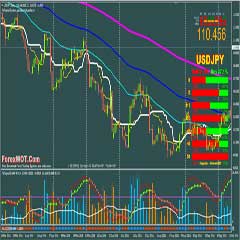
Go SHORT
- When price crosses Kijun-sen from above, closes below it and RSI is below 50.
- When price moves up, tests and rejects Kijun-sen from below and RSI is below 50.
- When price tests, rejects and forms a pin bar at a resistance level.
- Solar Wind Joy RED
- Pin bar = hammer, hanging man, inverted hammer, shooting star and doji
Exit Strategy:
- Exit when price crosses Kijun-sen in the opposite direction.
- Exit when profit target is hit.
- Exit when stop loss is hit.
- Exit when trailing stop is hit.
RSI Kijun-sen Forex Trading Risk Management
Option #1 (My personal favorite):
- Place a 40 pip stop loss
- Place a 60 pip trailing stop
- Move stop to breakeven plus spread after price moves +40 pips
- Pullback Entries (Add 34 EMA Median)
- When price pulls back, tests, rejects and closes in the direction of the trend and RSI is above 50 then it is a valid scale-in/add-on entry
- 1st position should have a 40 pip stop loss, 120 pip target and 60 pip trailing stop
- All other positions should have a 40 pip stop loss, 80 pip target and 40 pip trailing stop
Option #2 (recommended for newbies):
- Place a 40 pip stop loss
- Place an 80-120 pip profit target (2:1 to 3:1 reward to risk ratio)
- Place a 60 pip trailing stop
- Move stop to breakeven plus spread after price moves +40 pips
Option #3:
- Place two (2) half-sized positions
- Place a 40 pip stop loss on both positions
- Place an 80 pip profit target and 60 pip trailing stop on the first position
- Place an 80 pip trailing stop on the second position
 Get Rich Quick and Make Money From Forex Binary Options with EMA Kijun-Sen Trading Strategy
 Best Simple Forex Strong Trade Setups : Tenkan-Sen Kijun-Sen Reversal Trading System and Strategy
 MA COBRA Forex & Stocks Trading Strategy (Extremely Low Risk High Reward Trading Strategy) (COBRA SYSTEM)
 2 MACD Effortless Forex & Stocks Swing Trading Strategy
 Forex Currency Trading Course : How to Trade Forex Successfully with U-TURN Cross Over Trading System
 Forex Tenkan-Sen Kijun-Sen Mega Trend Strategy With High Accuracy Trading Filter Indicators
 Complete Guide To Forex Trading : Forex Long Term or Short Term Trading Strategy
 Forex MACD Pip Pirate Trading System – High Profit Trading During the London and US Sessions
 Forex and Crypto “MORNING TRADE” Trading Strategy for Advanced Traders
 Forex SAS System and Indicators – Making Money in Forex Capital Markets is Easy
