In this report, I will show you how to trade the Secret Method trading system. Since its invention, this method has been kept a secret for a very long time.

The main advantage of this system is its conservativeness in entering and managing trades, and of course, it can be traded in any timeframe.
Timeframe:
All timeframes
Currency Pairs:
Major pairs like the EUR/USD and the GBP/USD.
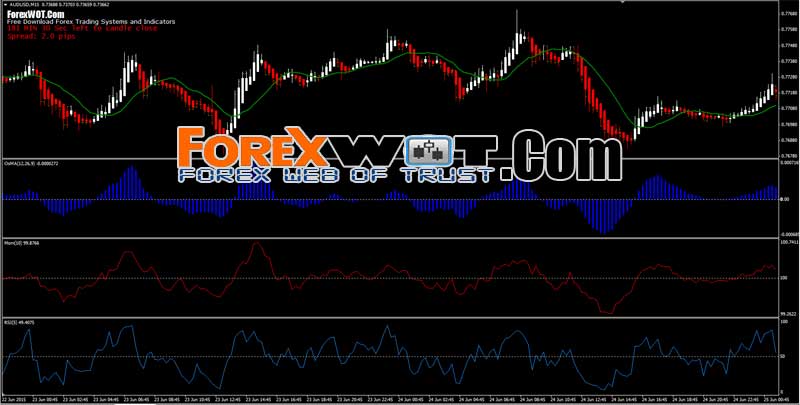
Indicators:
- Heiken Ashi
- 14 period Simple Moving Average (SMA)
- Moving Average of Oscillator (OsMA) – at default settings (12,26,9).
- 10 period Momentum – level set at 100.
- 5 period Relative Strength Index (RSI)
1. Heiken Ashi
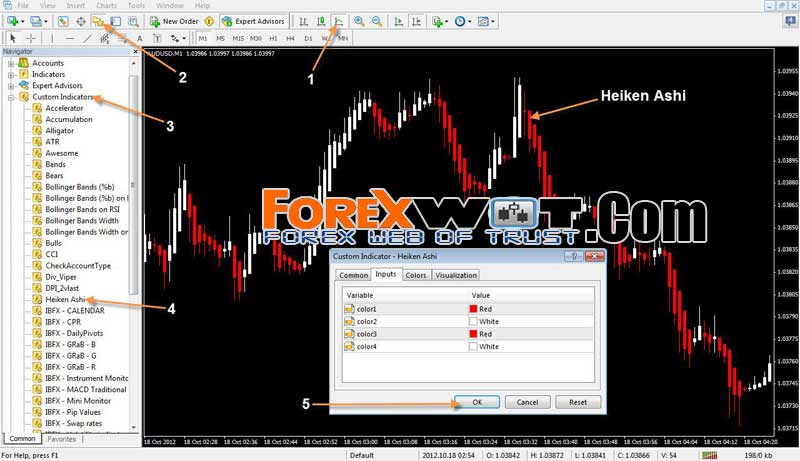
- Click on the Line Chart button to make the line chart appear. We will be using Heiken Ashi candles instead of regular candles.
- Click on the Navigator button to open the Navigator widow.
- Click on Custom Indicators to expand the list of indicators.
- Find Heiken Ashi on the list and double click on it for the settings dialogue box to pop up.
- Click on the OK button for the Heiken Ashi candles to appear on the chart.
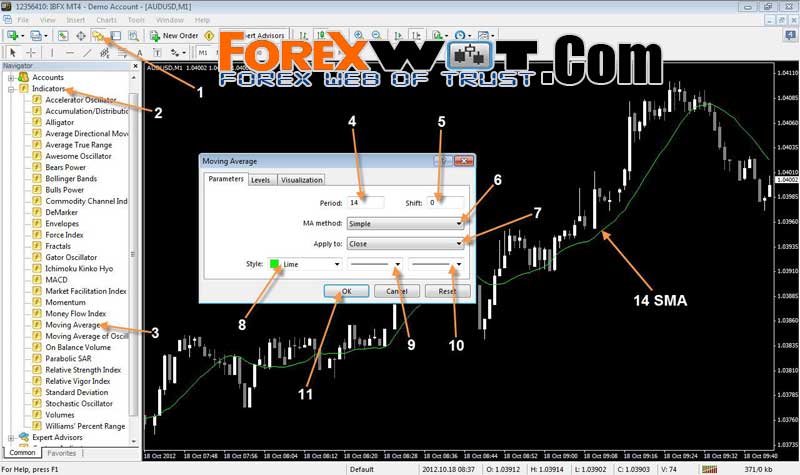
2. 14 period Simple Moving Average (SMA)
- Click on the Navigator button to open the Navigator widow.
- Click on Indicators to expand the list of indicators.
- Find Moving Averages on the list and double click on it. The settings dialogue box will pop up, where you can set the parameters of the 14 SMA.
- Set the Period at 14.
- Leave the Shift at 0.
- Click on the MA method drop down menu and select Simple.
- Leave the Apply to section at the default value, Close.
- Click Style to choose the color for your 14 SMA. On this chart, Lime is being used.
- Leave the line type as it is by default.
- This is for setting the 14 SMA line width.
- Click on the OK button to apply the 14 SMA on your chart.
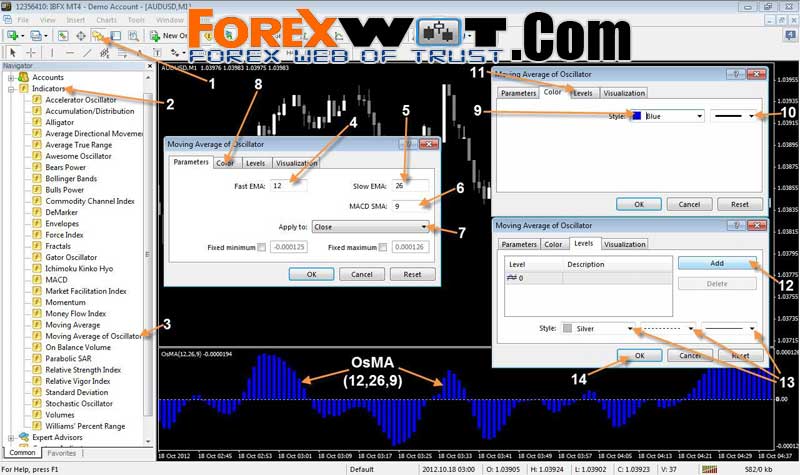
3. Moving Average of Oscillator (OsMA) – default settings (12,26,9).
- Click on the Navigator button to open the Navigator widow.
- Click on Indicators to expand the list of indicators.
- Find OsMA on the list and double click on it. The settings dialogue box will pop up, where you can set the parameters of the OsMA.
- Leave the Fast EMA at 12 (default).
- Leave the Slow EMA at 26 (default).
- Leave the MACD SMA at 9 (default).
- Leave the Apply to at Close (default).
- Click on the Color tab to set the color of the OsMA.
- Click Style and select Blue for the color of your indicator.
- This is for setting the OsMA histogram bar’s width.
- Click on Levels for the settings dialogue box to pop up, where to set the level.
- Click on Add and a 0 level will appear on the left side of the box.
- Here you can customize the level color, line type and width. Leave all of them as they are by default.
- Click on the OK button to apply the OsMA on your chart.
4. 10 period Momentum – level set at 100.

- Click on the Navigator button to open the Navigator widow.
- Click on Indicators to expand the list of indicators.
- Find Momentum on the list and double click on it.
- Set the Period at 10.
- Leave the Apply to section at the default value, Close.
- Click Style send select Red for the color of the indicator.
- Leave the line type as it is by default.
- This is for setting the line width.
- Click on Levels tab to set the indicator’s level.
- Click on the Add button and enter 100 for the level.
- Here you can customize the level color, line type and width. Leave all of them as they are by default.
- Click on the OK button to apply the Momentum on your chart.
5. 5 period Relative Strength Index (RSI) – level set at 50.
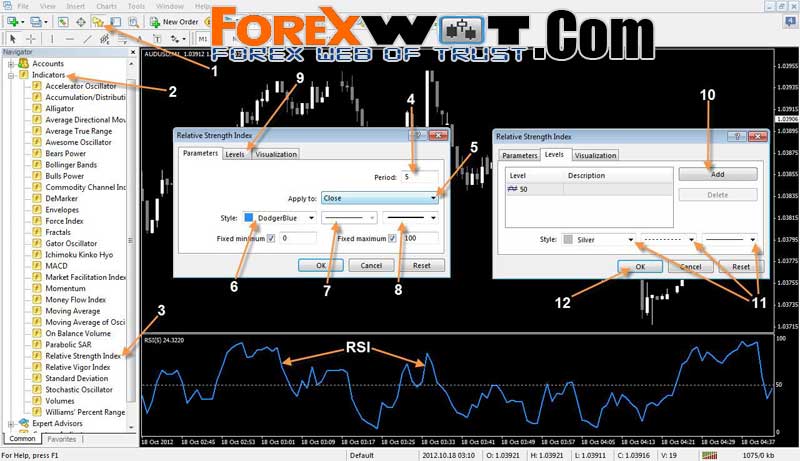
- Click on the Navigator button to open the Navigator widow.
- Click on Indicators to expand the list of indicators. (2)
- Find Relative Strength Index (RSI) on the list and double click on it.
- Set the Period at 5. (4)
- Leave the Apply to section at the default value, Close.
- Click Style and select DodgerBlue for the color of the indicator.
- Leave the line type as it is by default.
- This is for setting the line width.
- Click on the Levels tab.
- Click on the Add button and enter 50 for the level.
- Here you can customize the level color, line type and width. Leave all of them as they are by default.
- Click on the OK button to apply the RSI on your chart.
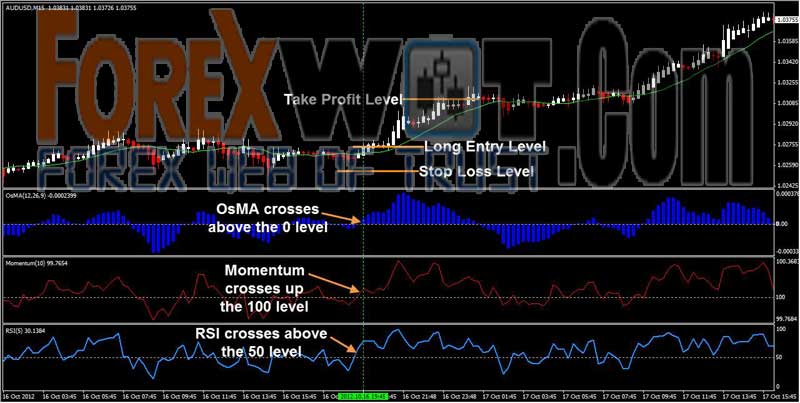
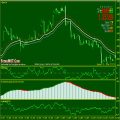
- A bullish Heiken Ashi candle (white) crosses above the 14 SMA.
- The OsMA crosses above its Zero level.
- The Momentum indicator crosses above the 100 level.
- The RSI crosses above the 50 level.
- As soon as all conditions mentioned above are met, we wait for the current candle to close then place a buy order.
- Set the Stop Loss a few pips below the last swing low point.
- Set the Take Profit at double the amount of the Stop loss.
- We can close our long trade without waiting for the Take profit to be hit when OsMA crosses below the Zero level.
Let’s have a look at a long trade example on the next page.
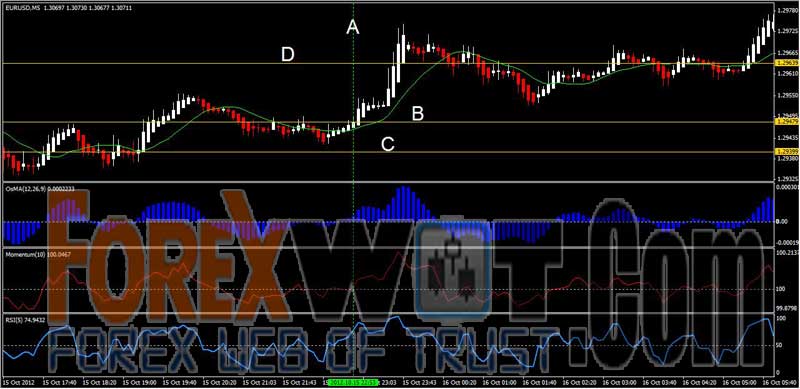
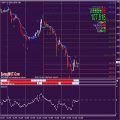
On the image above, we have a EUR/USD M5 chart, where a long trade was taken. The vertical line (A) marks the exact signal candle.
Two candles before that signal candle, the price has moved above the 14 SMA forming white bullish Heiken Ashi candles. The OsMA was following the price closely and has been above the 0 level for the past two bars. The Momentum has just crossed above the 100 level, while the RSI has been above the 50 level for a while.
As soon as all the rules were met and the current candle closed above the 14 SMA, a long position was opened at 1.29479 (B).
Next, the Stop Loss was set just below the last swing low, at 1.29399, or exactly 8 pips under the entry (C).
The Take Profit of 16 pips was also set, at 1.29639, which is exactly double the Stop Loss (D).
As you can see, the Take Profit was hit 35 minutes later.
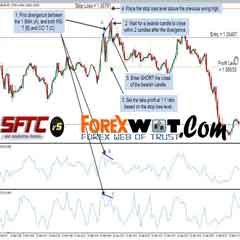
Now let’s take a look at Short trade conditions.
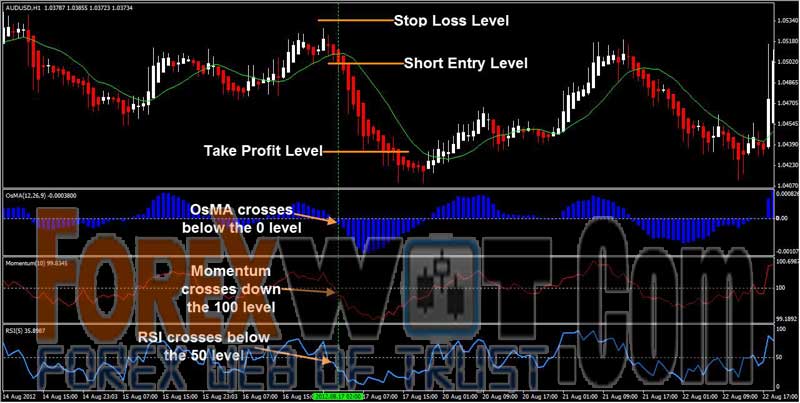
- A bearish Heiken Ashi candle (red) crosses below the 14 SMA.
- The OsMA moves below the Zero level.
- The Momentum indicator crosses below the 100 level.
- The RSI crosses under the 50 level.
- As soon as all conditions mentioned above are met, wait for the current candle to close and open a short trade.
- Set the Stop Loss a few pips above the last swing high.
- Set the Take Profit at double the amount of the Stop loss.
- We can close our short trade without waiting for the Take profit to be hit when OsMA goes above the Zero level.
Let’s take a look at a short trade example.
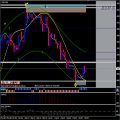
Below, you can see an AUD/USD M30 chart, where a short trade was taken.
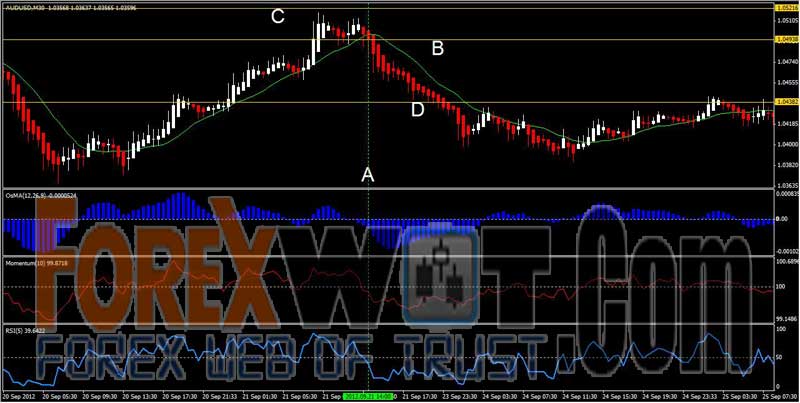
The vertical line (A) shows the signal candle.
The first sign to start looking for a short entry was the candle before the formation of the previous bearish red Heiken Ashi candle, followed by the close current candle below the 14 SMA. The OsMA has gone below the 0 level two candles ago. The Momentum indicator crossed below the 100 level on the previous candle. The RSI has just crossed under the 50 level.
After the close of the current signal candle, a sell order was placed at 1.04938 (B).
Immediately after that, a Stop Loss was set at 1.05216, which is 27.8 pips above the entry and a few pips above the closest swing high (C). The Take Profit of 55.6 pips was set at 1.04382 (D).
The price kept falling and the Take Profit was hit not long after.
Not many traders know this strategy and it has been kept secret because of its profitability. Test this system, try it out on your charts and see for yourself.
Thank you for the time you spent with me and I hope you will benefit from what you have learned today.
 Foreign Exchange Trading : Online Forex Master Level Trading System and Strategy
 Best Results MACD – Bollinger Bands Forex Trading System and Indicators
 Forex & Stocks Trading Strategy with EMA-MACD Trend Dominator System
 Top 10 Super Effective High Profits Forex Heiken Ashi Trading System and Strategy
 Forex Golden Trading System With Such a High Winning Percentage
 Most Successful Forex Trading Strategy – Moving Average of Oscillator (OsMA) Support Resistance Trading System
 5 Minute Chart Surefire RSI-CCI Forex Trading System and Strategy
 MA COBRA Forex & Stocks Trading Strategy (Extremely Low Risk High Reward Trading Strategy) (COBRA SYSTEM)
 Super Effective Follow Trend Trading with Heiken Ashi Profit Supreme
 ZMA Heiken Ashi System – Easy Way To Identify The Direction Of The Trend
