SMA-RSI Forex Trading System. This system is a trend follower in nature, and it’s mainly designed to catch the long term trend movement and follow it until it changes direction and start an opposite trend.

It’s also designed to keep traders away from the market if the trend is too weak or there is no clear/strong trend direction.
What makes this system even more powerful is that it’s easy to follow and understand. It doesn’t require any trading experience.
Best Time frame is 1 Hour Chart, the system can be used with all currency pairs.
You will find a readymade template ( works with Metatrader4 software ) that would install all indicators used with this system.
( Right click on chart >> click on “templates” >> choose EMA-RSI Billkiller )

The system uses two main indicators to identify major trend’s direction.
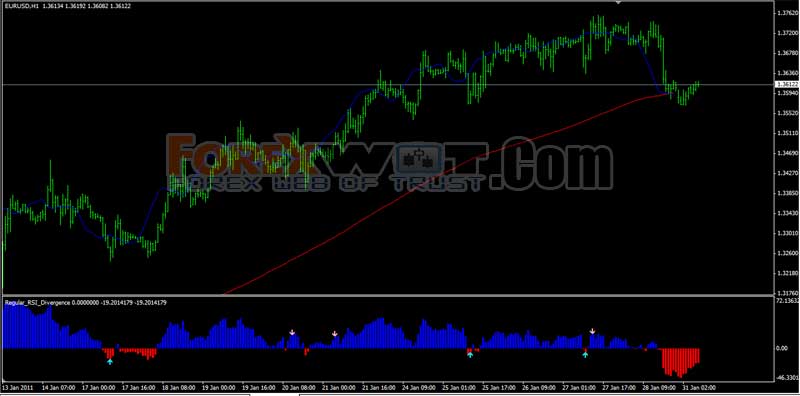
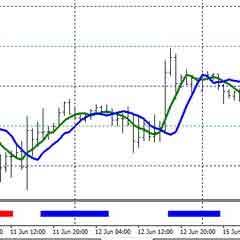
First indicator: Simple Moving Average ( 9 SMA and 200 SMA )

How to read this indicator and identify the trend?
- 9 SMA ( Blue Line ) Above 200 SMA ( Red Line ) = Up Trend
- 200 SMA ( Red Line ) Above 9 SMA ( Blue Line ) = Down Trend
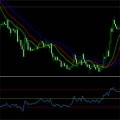
- Second indicator used with this system is RSI Divergence ( Period : 21 )

How to read this indicator and identify the trend ?
- Red Bar Below 0 line, After Down Arrow = SELL Signal
- Blue Bar Above 0 line, After Up Arrow = BUY Signal
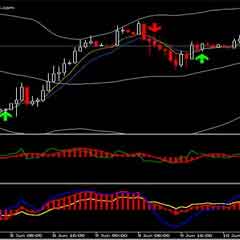
- Down Trend Signal
- SELL Signal
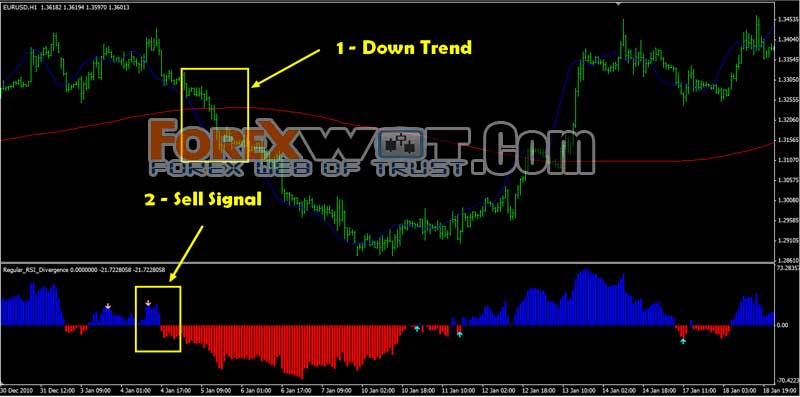
- Simple Moving Average = Down Trend Signal
- RSI Divergence = Sell Signal
That means you can open SELL market order
- Up Trend Signal
- SELL Signal

- Simple Moving Average = Up Trend
- RSI Divergence Indicator = Buy Signal
That means you can open BUY market order
Playing with stop loss and profit taking is an art. It requires a bit experience. So if you are new to trading, you can use the following simple rules:
- Place target profit to 30 pips. And set stop loss to be the same.
Get out of the trade when you reach target profit, or when you see the reverse signals. For example, when you are in a buy trade, get out when you see one of the two indicators change color.
If you are an experienced trader, please go ahead with the next section describing how you can place targets & stop loss with Fibonacci levels.
For targets and stop loss , we are going to use one of the most powerful trading tools. The Fibonacci levels!
Again, this section is only for advanced traders. So let’s go ahead.
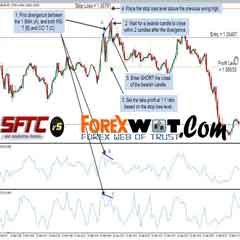
The principle is: Once price breaks support or resistance, we place Fibonacci levels over the last wave for that level.

The above example shows USD/CAD 1H chart, support was just broken and we placed Fibonacci levels over the high and low of price wave.
- Our Stop loss would be the 0.0 level
- And First Target would be the 161.8 level
- Second Target would be 261.8 level
If you are going to set your target to the second target, I recommend that you use a trailing stop loss to protect your profits.
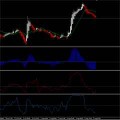
Here is a screen shot for the above example trade, showing entry/stop loss and targets…

EUR/USD – 1H Chart

In the above example , the system generated a buy signal ( Up trend ).
What we have done next is that we used Fibonacci levels to set entry/targets and stop loss levels once 1H resistance was broken.
 Foreign Exchange Trading : Online Forex Master Level Trading System and Strategy
 MA COBRA Forex & Stocks Trading Strategy (Extremely Low Risk High Reward Trading Strategy) (COBRA SYSTEM)
 5 Minute Chart Surefire RSI-CCI Forex Trading System and Strategy
 RSI Momentum Secret Method Forex Trading System – Step by Step Tutorial
 Forex Trading Short Course – How to Trade Forex with COG Trading Indicators and Strategy
 Forex Currency Trading Course : How to Trade Forex Successfully with U-TURN Cross Over Trading System
 2 MACD Effortless Forex & Stocks Swing Trading Strategy
 FREE DOWNLOAD 20+ Best Forex MACD-Moving Average Trading System
 A Complete Trading System Used by Professionals to Make Millions
 Forex Forbi EMA-Bollinger Moderate Swing and Trend Trading Strategy
