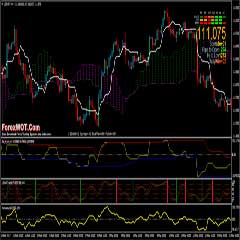
Forex Ichimoku Trading System with ATR Ratio and ADX Indicators – Ichimoku Kinko Hyo with ATR Ratio and ADX Indicators is a trend following trading system filtered with ATR Ratio and ADX. The signal alert is the Super Reversal Signal a indicator created for trading with forex and Binary Options high/low.


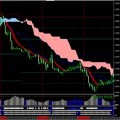
‘The Ichimoku Cloud’, also known as Ichimoku Kinko Hyo, is a versatile indicator that defines support and resistance, identifies trend direction, gauges momentum and provides trading signals.
Ichimoku Kinko Hyo translates into “one look equilibrium chart”. With one look, chartists can identify the trend and look for potential signals within that trend.
The indicator was developed by Goichi Hosoda, a journalist, and published in his 1969 book. Even though the Ichimoku Cloud may seem complicated when viewed on the price chart, it is really a straight forward indicator that is very usable. It was, after all, created by a journalist, not a rocket scientist! Moreover, the concepts are easy to understand and the signals are well-defined.
Four of the five plots within the Ichimoku Cloud are based on the average of the high and low over a given period of time.
For example, the first plot is simply an average of the 9-day high and 9-day low. Before computers were widely available, it would have been easier to calculate this high-low average rather than a 9-day moving average. The Ichimoku Cloud consists of five plots:
Tenkan-sen (Conversion Line): (9-period high + 9-period low)/2))
The default setting is 9 periods and can be adjusted. On a daily
chart, this line is the mid point of the 9 day high-low range,
which is almost two weeks.Kijun-sen (Base Line): (26-period high + 26-period low)/2))
The default setting is 26 periods and can be adjusted. On a daily
chart, this line is the mid point of the 26 day high-low range,
which is almost one month).Senkou Span A (Leading Span A): (Conversion Line + Base Line)/2))
This is the midpoint between the Conversion Line and the Base Line.
The Leading Span A forms one of the two Cloud boundaries. It is
referred to as “Leading” because it is plotted 26 periods in the future
and forms the faster Cloud boundary.Senkou Span B (Leading Span B): (52-period high + 52-period low)/2))
On the daily chart, this line is the mid point of the 52 day high-low range,
which is a little less than 3 months. The default calculation setting is
52 periods, but can be adjusted. This value is plotted 26 periods in the future
and forms the slower Cloud boundary.
Make 200% Profit Monthly with Super Signals Channel Forex and Binary Options Trading System and Strategy Trade Ideas & Technical Chart Analysis by ForexWOT, March 26th to 30th 2018 Forex Profit Matrix – Stay in Strong Trends with the Heiken Ashi Candlestick and Bollinger Band FREE DOWNLOAD Top 10 Forex Currency Trading Systems With Bollinger Bands Indicator Chikou Span (Lagging Span): Close plotted 26 days in the past
The default setting is 26 periods, but can be adjusted.
‘Average True Range – ATR’ – A measure of volatility introduced by Welles Wilder in his book: New Concepts in Technical Trading Systems.
The true range indicator is the greatest of the following:
- Current high less the current low.
- The absolute value of the current high less the previous close.
- The absolute value of the current low less the previous close.
The average true range is a moving average (generally 14-days) of the true ranges.
BREAKING DOWN ‘Average True Range – ATR’
Wilder originally developed the ATR for commodities but the indicator can also be used for stocks and indexes. Simply put, a stock experiencing a high level of volatility will have a higher ATR, and a low volatility stock will have a lower ATR.
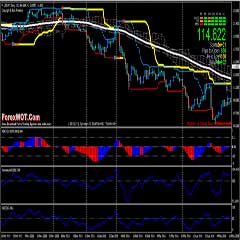
Trading in direction of the trend with ATR Ratio > level 1.
- Price above Ichimoku,
- Pet-D bar color blue
- Alert Buy of Super Reversal Signal,
- ATR Ratio > levele 1.
- ADX Line Upward above 23 line

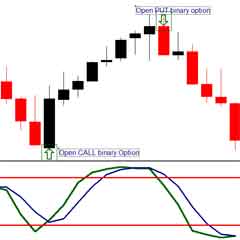
- Price below Ichimoku,
- Pet-D bar color red,
- Alert sell of Super Reversal Signal,
- ATR Ratio > levele 1,
- ADX Line Upward above 23 line.

Make profit at the levels of Bobokus Fibonacci or exit at the first bar with color opposite color. (Example if you are trade buy, the opposite bar is red, if you are trade sell, the opposite bar is green).
Place initial stop loss below/above the entry bar.
 DOWNLOAD Top 7 Best Forex Ichimoku Trading System and Strategy
 Top 10 Forex ADX Trading System (High Accuracy ADX System)
 The Turtle Channel Online Forex Currency Trading System Filtered With Ichimoku Cloud and MACD
 M15 Double Ichimoku Cloud Forex Trend Trading System with BBands Stop and 4 MTF HAS Bars Indicator (HA)
 High Accuracy “H4 Time Frame” Trading Strategy Based on Ichimoku and Pallada Entry Signal
 MA COBRA Forex & Stocks Trading Strategy (Extremely Low Risk High Reward Trading Strategy) (COBRA SYSTEM)
 IBS Reversal Ichimoku Trading System : How To Use Ichimoku Cloud To Trade Forex
 Top 10 Strategy to Build on Your Winning Forex Open Positions
 FREE DOWNLOAD Top 10+ Best Forex Trading Systems for Beginners
 Top 10 High Accuracy Forex Stochastic Trading Strategy
