How To Trade on Powerful Support and Resistance Levels – This system is more than amazing. By using this system you are trading with the 10% winning side of forex market. Why ? because it doesn’t blindly follow the trend. But instead, it gives you the chance to trade on powerful support and resistance levels as well.

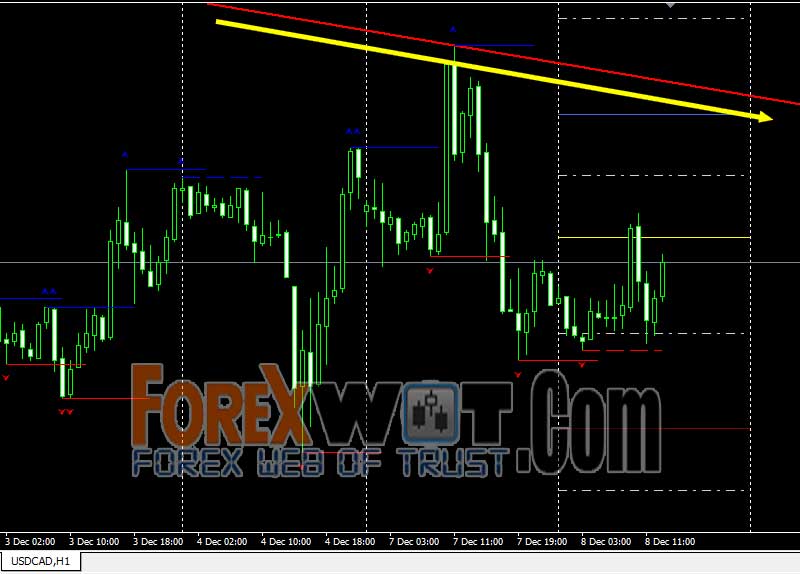
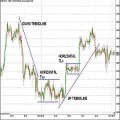
And this is how professional trades work. Overview of the system – Screen 1 :

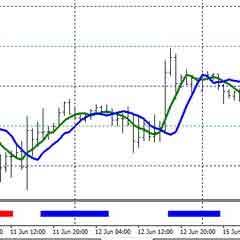
- Trend : This is the main trend, or the main direction of price at the moment.
- Past Support and Resistance : This is where supply and demand in the past was. These key points are VERY important. More on that later.
- Future Support and resistance : This is where future supply and demand is predicted to take palace. The yellow line is the main pivot line or middle support/resistance. The blue lines above are resistance lines. And the red lines below it are support lines. The gray lines between red and blue lines are suggested reversal points. This is how we are going to set our Targets.
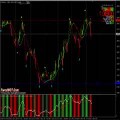
Overview of the system – Screen 2 :

On the upper left corner of the screen you will find this instruction area. It shows the major trend ( Trend Up – Trend Down ). And BUY – SELL signal with entry Point and Stop loss level.
This area is the last point we are going to check before we trade.
This system can be used with all pairs, but it will be a lot more profitable with USD/JPY pair.
This trading mode is for beginners. It’s very simple and clear.
- 1 – Use the Daily Chart to know the major trend of the currency pair.
For Example, here is the daily trend of USD/CAD:

As you can see, the major trend is Down Trend = Best to SELL this pair.
- 2 – Move to any smaller time frame, that shows the same trend direction.
For Example, 1 Hour chart:
- 3 – Follow the instructions on the screen for Entry and Stop loss.
- 4 – Set your Targets based on the Pivot lines ( the horizontal lines above or below the yellow line – yellow line and gray lines are included ! )
- 5 – If the Stop loss was too big for your account size, simply move to smaller time frames. I would suggest 15 Minutes chart for mini accounts.
AVOID trading during important news releases !
If in doubt – Stay out and choose another pair.
Trade the system on a demo account for at least 2 weeks before going live.
Use Trailing Stops to lock your profits.
For traders with little more trading experience, we are not only going to enter our main trades in the direction of the main trend as explained in the basic mode, but we are also going to enter small trades in the same direction or/and in the opposite direction based on support and resistance levels.
This kind of trading is best done with currency pairs that don’t show a clear trend for a long period of time. Like USD/CAD and EUR/USD.
In this mode we are not going to enter the market based on the recommendations on the upper left side of the chart. So please stay focused!
Our Entry and Exit points are the support and resistance levels :

Stop loss for this method is about 5 -10 pips above or below Signal point.
For Example :
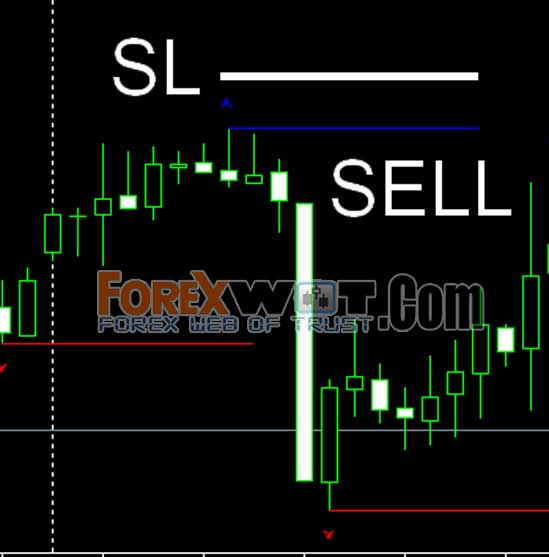
SL = Stop Loss
Very Important : Only trade the SOLID lines.
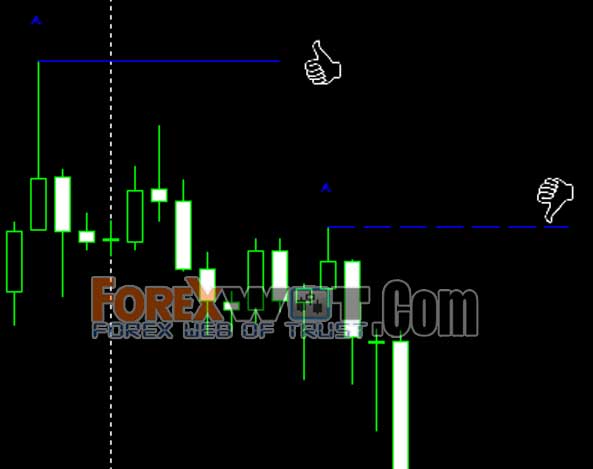
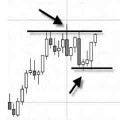
Another way to trade support and resistance, is like this example :

Our entry was not a Blue resistance line, but right when price hit the red – support – level and started to turn in the direction of the main trend.
The Stop loss in this case was the last support level and the Target was the next resistance level. You can use only one target per trade or more than one Target as you can see from the example above.

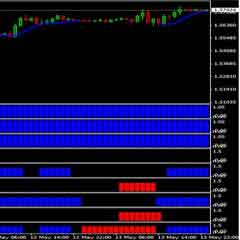
In the Advanced mode, you will find 3 additional – and very important – indicators.
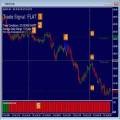
- Bars Indicator: This bar will color price candles in Red = down trend or blue = up trend.
- Market Data: This indicator shows general and special market information. Like daily high/low and spread.
- Future Line: This indicator shows the predicted move of the price in the near future. This indicator doesn’t only mirror the last move and reverse it like many others. But it really predicts the next move based on very complicated formula and market analysis. It’s better used with 1 Hour and 4 Hour chart.
The system is very simple, clear and profitable. And more important .. it’s not like most systems out there. This system is designed based on how professional traders read the market and trade.
There is no need to add anything to it. It was designed to be as simple as possible. However, if you are experienced enough .. I would recommend that you take advantage of price patterns like double tops and double bottoms and triangles to make it even more powerful. And watch for strong candle formations, like Pin Bars and Inside Bars for entry/exit confirmations.
If you are a beginner, this system would be perfect for you as it is. Open a demo account, and start using, testing and trading with the system for few weeks. And let me hear about your results with it.
 MA COBRA Forex & Stocks Trading Strategy (Extremely Low Risk High Reward Trading Strategy) (COBRA SYSTEM)
 High Profits and Super Effective FCP Forex Trading System (Forex Secret Protocol)
 Forex Currency Trading Course : How to Trade Forex Successfully with U-TURN Cross Over Trading System
 Mapping Forex Price Action Trading Strategy
 2 MACD Effortless Forex & Stocks Swing Trading Strategy
 5 Minute Chart Surefire RSI-CCI Forex Trading System and Strategy
 Foreign Exchange Trading : Online Forex Master Level Trading System and Strategy
 Complete Guide To Forex Trading : Forex Long Term or Short Term Trading Strategy
 How to Do Accurate Forex Trend Line Analysis
 Support and Resistance Trading Strategy – Simple Easy Forex Support Resistance Trend Trading System and Strategy
