I trade with the EURUSD a lot because of low spreads. I also like to trade on the 5 Minute chart. However, my system can be used in other currency pairs and timeframes as well.

My system is a very simple scalping system, so anyone who has traded before will have no trouble learning to trade it because the indicators and concepts that I use in the system are very popular.
If you are a beginner, I’m sure it won’t be long before you can learn the system. All you need to do is read carefully, watch the videos and practice trading the system.
In this manual, I will explain each indicator I use in the system. I will move on to explain the techniques such as identifying divergence setups and also finding support and resistance levels. I will also show you how to setup your chart. After that, I will show you the system rules and give some examples of trades.
Forex Trading System Description
How did you come up with the system you have traded during the competition?
I’ve done a lot of trial and error, trying every system and indicator I could find until something fits my style.
Does your system use any custom indicators?
No, I just use the RSI and CCI that are found in the MetaTrader4.
Do you follow a set number of rules on each and every trade?
Yes, it is pretty set in how I do it.
Are there any exceptions to your trading system rules?
No, there really isn’t any exception.
Do you enter trades using market orders and/or pending orders?
I use the market orders to enter trades.
How do you determine the level/price where you will enter a trade?
I enter on the close of a candle in a favourable direction when a setup occurs.
What percentage of your account balance do you risk on each trade?
I would risk 3-5% of the account on each trade.
What would be the maximum drawdown you would risk on any trade?
The maximum drawdown is 5%.
What is the maximum lot size that you would use to enter any particular trade on a $1000 account? What is the maximum number of trades that you open at one time?
I would enter only one trade at a time, and maximum lot size depends on how much money 10 pips is worth, because some brokers are different in that sense. Basically, I won’t have a stop loss larger than 20 pips.
How long will you remain in a trade once it is opened?
I would keep it open however long it takes for it to hit the take profit or stop loss.
How do you determine the take profit level?
The take profit should be 1:1 ratio based on the stop loss.
Do you place a stop loss level? If so, how do you determine this level?
Yes, it is based on recent swing high/low plus or minus a few pips.
Do you exit trades before your stop/target is hit?
I don’t normally exit trades early, although, I usually move my stop to breakeven when I get ahead by 8-10 pips.
Which signals will cause you to exit early?
If price is really stalling or getting rejected, I may take my profit and run early.
Are there any particular months or weeks that you prefer not to trade and if so why?
I like to take the last half of December and the first week in January off due to lack of volume.
Would you consider your system to be easily understood by beginners, or is it better suited to intermediate or advanced level traders?
I think setups are very easy to spot in my system. It would help to understand what divergence is though.
Does your method use Support/Resistance? Please explain how you apply this in your method?
I see horizontal lines of support and resistance but I don’t draw them, just imagine them on the chart. The system doesn’t rely on it. I try to find places where price may reverse, so I pay close attention to price when it is near previous levels of support and resistance or round numbers (ending in 00).
Components Of The System
In this section, I will show you the different components of the system. My system is very simple. There are two indicators, which I use to look for divergences with price, and I apply some techniques on support and resistance to identify the stop loss and take profit.
Indicators
First, I will talk about the indicators I use, which are the Relative Strength Index (RSI) and the Commodity Channel Index (CCI).
Relative Strength Index (RSI)
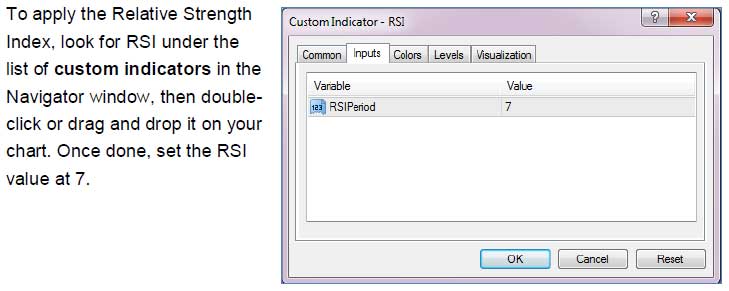
The Relative Strength Index is one of the famous indicators developed by J. Welles Wilder. The RSI is used for many different purposes in various trading systems because of its ability to measure the momentum of price movement. I use the 7 period RSI as you can see below:

RSI compares the gains and losses of the market in order to show the current and historical strength or weakness of price, and plots that on a 0 to 100 scale. This is why it’s called “relative strength index”, and is a momentum oscillator by definition. So, when price moves up, the RSI also moves up, and vice versa.
Normally, the RSI is displayed with specific levels for identifying overbought (70) and oversold (30) levels. But for my system, I don’t need those levels because I just use the RSI to identify divergence with price. We’ll talk more about divergence later, so don’t worry about that just yet.
Commodity Channel Index (CCI)
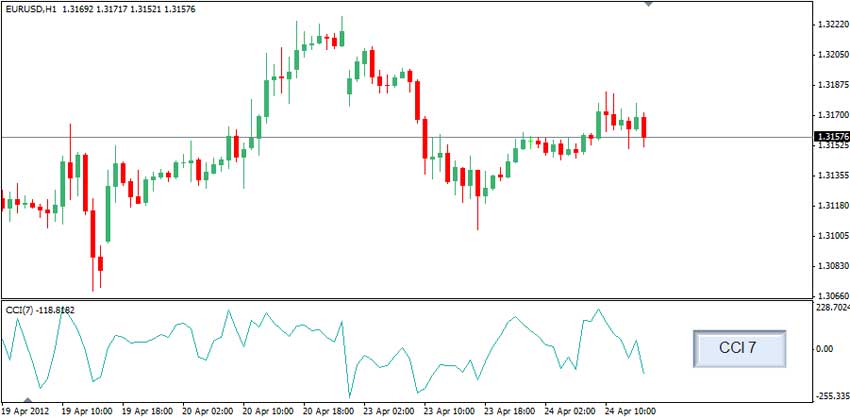
The Commodity Channel Index (CCI) was developed by Donald Lambert. Just like the RSI, the CCI is a momentum oscillator.
It compares the difference between a security’s price change and its average price change. In other words, the CCI is at high levels when prices are higher than usual, and it is at low levels if the prices are lower than usual. The CCI can also be used to identify overbought or oversold, but I also use it to identify divergences for trading signals. I use the 7 period CCI for my trading system.
Divergence
Now we’ll talk about divergence. This is the main technique I use for identifying buy and sell trade signals.
Normally, the indicators I use, the RSI and CCI, follow price movements. They go up when the price moves up, and they go down when the price moves down. However, there are instances when the RSI and CCI are moving in an opposite direction of the price. This is what we call divergence, and it indicates that the trend will soon change.
Bullish Divergence
When the price makes lower lows but the indicators are making higher lows, you have a bullish divergence.
In the example to the left (below), you can see that I drew a line (A) to connect the lows of the SMA. I also connected the lows of the indicators (B and C). The price is making lower lows, while RSI and the CCI are making higher lows.
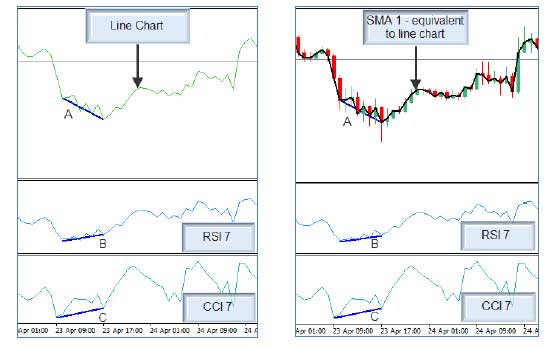
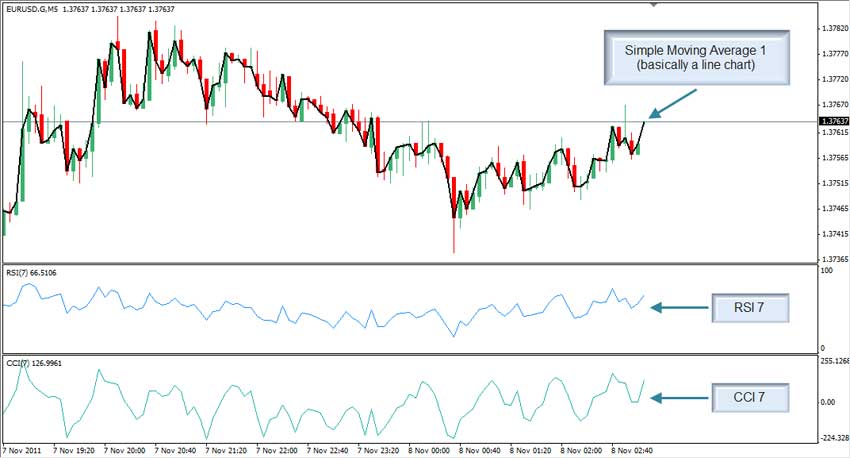
This is the basis for divergence in my system, and not the candlesticks. As a comparison, look at the second example. I applied 1 period Simple Moving Average (SMA) on the candlesticks. The SMA is looks exactly like the price as it appears on the line chart.
The 1 SMA and the line chart are basically the same. When looking for divergence, be careful not to use the highs and lows of the candlesticks. Instead, look for the highs and lows of the 1 period SMA or the line chart.
When the indicators begin to move up, even if the price is still going down, this means that the price is beginning to gain some momentum in the upward direction. The current downtrend is now weak, and a new uptrend will soon take place.
To identify a bullish divergence, the lines are drawn below both price and indicators, and the direction of the lines on the indicators are going up even if the price is going down.
Bearish Divergence
Bearish divergence is the exact opposite of bullish divergence. Here, the price makes higher highs but the indicators are making higher lows.
In the first example below, I drew a line (A) to connect the highs of the price. On the indicator windows, you can see that I drew lines (A and B) connecting the highs as well, but this time, they are pointing down. The price is making higher highs, while RSI and the CCI are making higher lows.
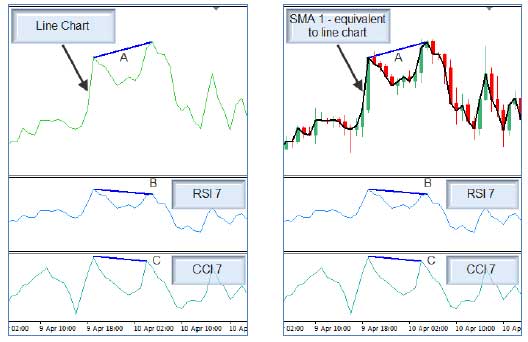
A bearish divergence indicates that price is losing momentum in the upward direction and beginning to gain some momentum in the downward direction. The trend will soon reverse.
To identify a bearish divergence, all lines are drawn above both price and trendline, and the direction of the lines on the indicators are going down even if the price is going up.
Support & Resistance
Support and resistance levels also play an important role in my system because they can give me a clue of whether or not the price will continue moving in a certain direction. I watch out for these areas for opportunities to enter reversal trades.
A level of support is the lowest maximum level that the price can reach. If price has reached the bottom, where it cannot move much lower, then it has hit a support level. This happens because the security is deemed undervalued and sellers are no longer willing to sell.
A level of resistance is the maximum high level that price can reach. Price stops increasing because the security is overvalued and no buyer is willing to buy. Have a look at the image below for examples of support and resistance levels.
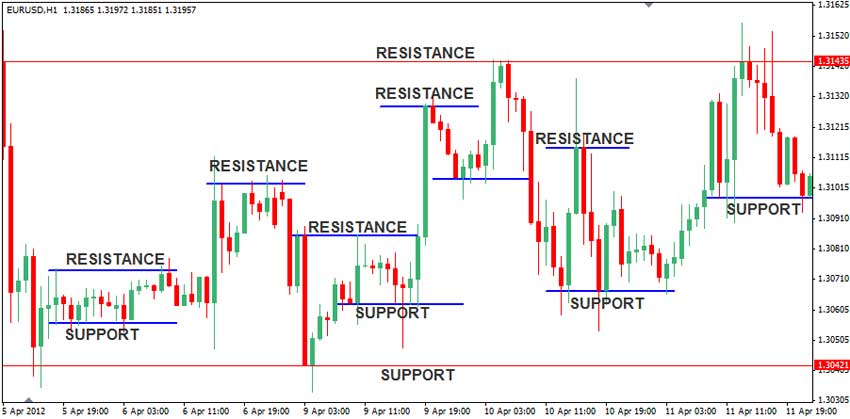
Chart Setup
In this section, I will show you how to setup your charts to trade my system using the MetaTrader4 platform.
I like to use the line chart, but if you would like to keep using the candlestick charts for some reasons, you can apply a 1 period Simple Moving Average to see exactly where the line appears on the line chart.
Normally, I use a black background, but for illustration purposes, I will make it white so it’s easy to print out this manual.
How to Setup Your Charts
Begin by opening a EURUSD 5 minute chart, or any currency pair and timeframe you would like to trade. Click on the buttons for Line chart or Candlestick chart, whichever you prefer, on the task bar. You can now change the appearance of your chart, right-click on it and select Properties.
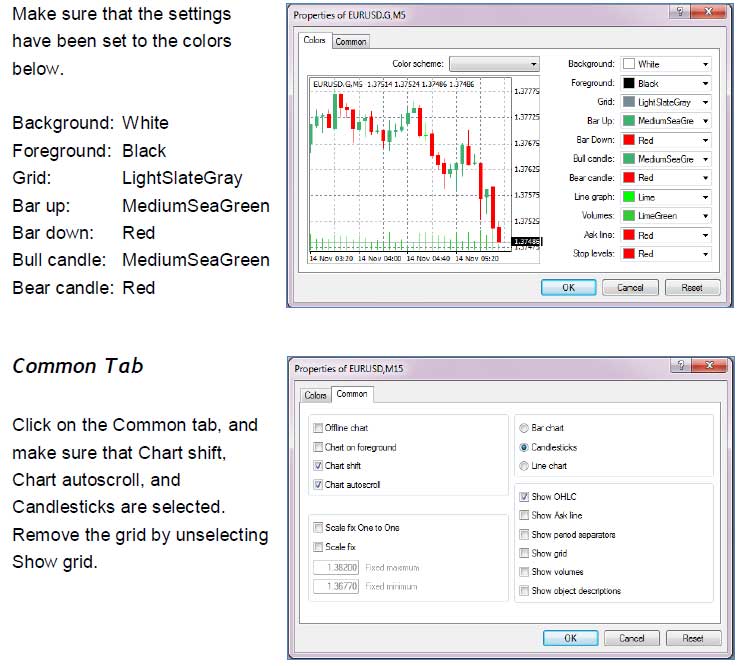
Properties, Colors Tab
If you prefer the black chart, you don’t need to change the colors. But if you want to use the white chart, select the Colors tab in the Properties dialogue box.
Indicators & Settings
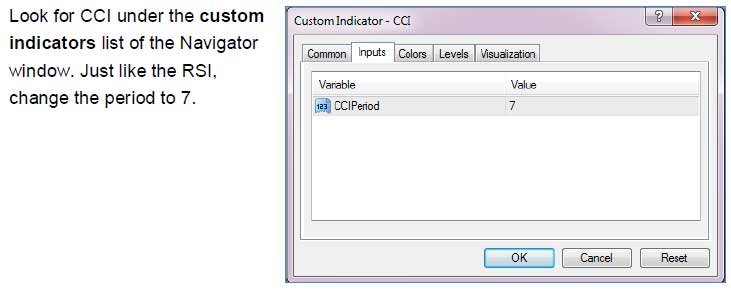
After setting the chart properties, it’s time to add in the indicators. Open the Navigator window (click on “Ctrl” + “N” or click on the Navigator button above the chart). Click on Custom Indicators in your Navigator window to view the list of indicators.
Relative Strength Index (RSI 7)
Commodity Channel Index (CCI 7)
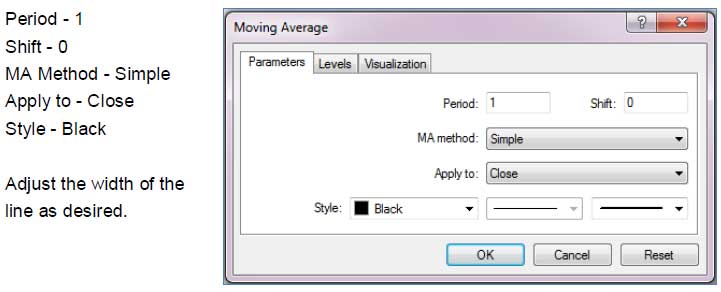
Simple Moving Average (1)
The SMA 1 is an optional indicator that you can apply to your chart. I usually shift from the candlesticks to line charts, but having the SMA 1 is quite convenient. To apply, find Simple Moving Average under the indicators list in the Navigator window, and enter the following settings:
Take note, both RSI and CCI are taken from the custom indicators list of your MetaTrader4 platform. If you’re not sure about your settings, you can watch my video on how to setup the charts. You can also get the chart template on the download page.
Buy/Long Trade Rules
- On the EUR/USD 5 Minute chart, wait for price to enter an area of interest, such as previous support/resistance or round numbers.
- Spot bullish divergence on the RSI and CCI with a line chart, or with an SMA 1 on a candle chart.
Bullish divergence occurs when the price makes a lower low but the RSI or CCI makes a higher low. - From the recent low that shows divergence, wait for a bullish candle to close within the next two bars.
- Enter long (buy) on the close of the candle.
- Set the stop loss below the swing low.
- Set the take profit 1:1 based on the stop loss level.
Note: Don’t trade during news releases. There are no exceptions to the rules.
In the next, you will find examples of long trades.
Buy/Long Trade Examples
Buy/Long Example 1
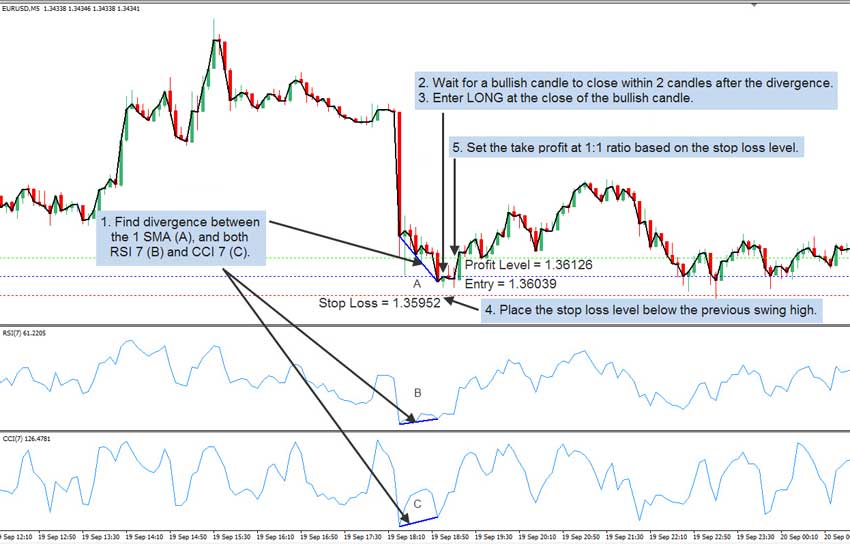
Here’s a buy trade example of the EURUSD 5 Minute chart, a bullish divergence occurred when the price was making a lower low as shown by line A, but the RSI 7 and the CCI 7 were making higher lows as shown by lines B and C.
For buy trades, the trigger candle is the candle which closes in the direction supported by the indicators. So, since lines B and were C sloping up, I looked for a bullish candle.
The next candle after the low was a bullish candle, so I entered at the close of that candle at 1.36039. I then set the stop loss level below the recent swing low at 1.35952. I set my take profit approximately the same distance of the entry to the stop loss level, at 1.36126. In 15 minutes, I got out of the trade with 8 pips of profit.
Buy/Long Example 2

Here’s another buy trade example on the EURUSD 5 Minute chart. The SMA was making a lower low (A), while the RSI 7 (B) and the CCI 7 (C) were making higher lows.
The next candle that formed after the lowest low was a bullish candle, so I entered the trade as soon as it closed at 1.36101.
I placed the stop loss level below the recent lowest low at 1.35918, which is 18 pips from the entry, and so I placed the take profit 18 pips above the price as well, at 1.36281.
The price was ranging for a while, but I kept the trade open to wait for price to reach the take profit or stop loss. Eventually, the trade was closed with 18 pips of profit.
Sell/Short Trade Rules
- On the EUR/USD 5 Minute chart, wait for price to enter an area of interest, such as previous support/resistance or round numbers.
- Spot bearish divergence on the RSI and CCI with a line chart, or with an SMA 1 on a candle chart.
Bearish divergence occurs when the price makes a higher high but the RSI or CCI make a lower high. - From the recent high that shows divergence, wait for a bearish candle to close within the next two bars.
- Enter short (sell) on the close of the candle.
- Set the stop loss above the swing high.
- Set the take profit 1:1 based on the stop loss level.
Note: Don’t trade during news releases. There are no exceptions to the rules.
In the next section, you will find examples of short trades.
Sell/Short Trade Examples
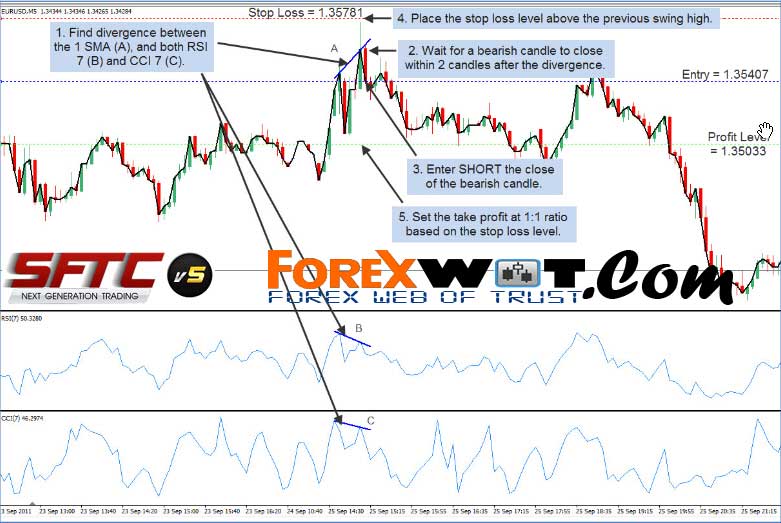
Sell/Short Example 1
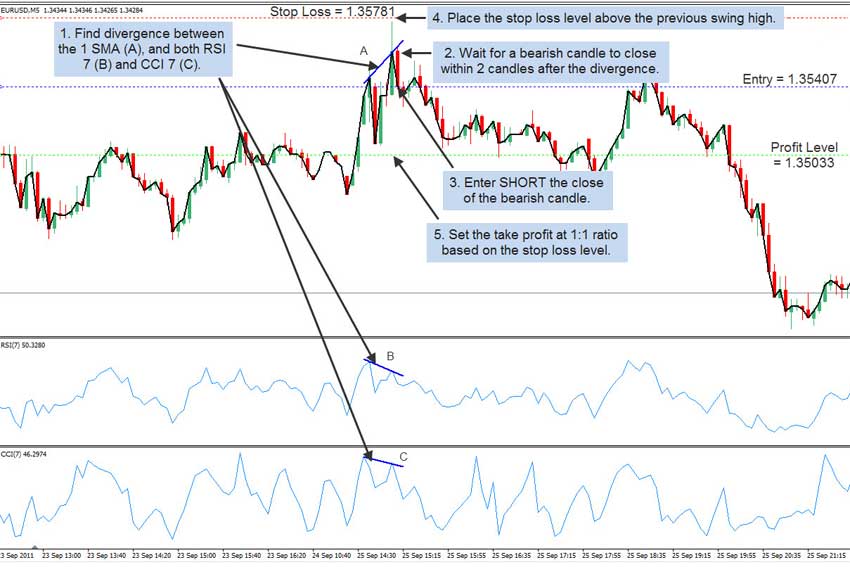
In this example, a bearish divergence occurred when the price was making a higher high as shown by line A, but the RSI 7 and the CCI 7 were making lower highs as shown on lines B and C.
The trigger candle is a candle which closes in the direction supported by the indicators. So, since lines B and were C sloping down, I looked for a bearish candle.
The next candle after the recent high was a bearish candle, so I entered at the close of that candle at 1.35407. I then set the stop loss level above the highest high at 1.35781. I set my take profit approximately the same distance of the entry to the stop loss level, at 1.35033 which was easily achieved, giving me 37 pips of profit.
Sell/Short Example 2
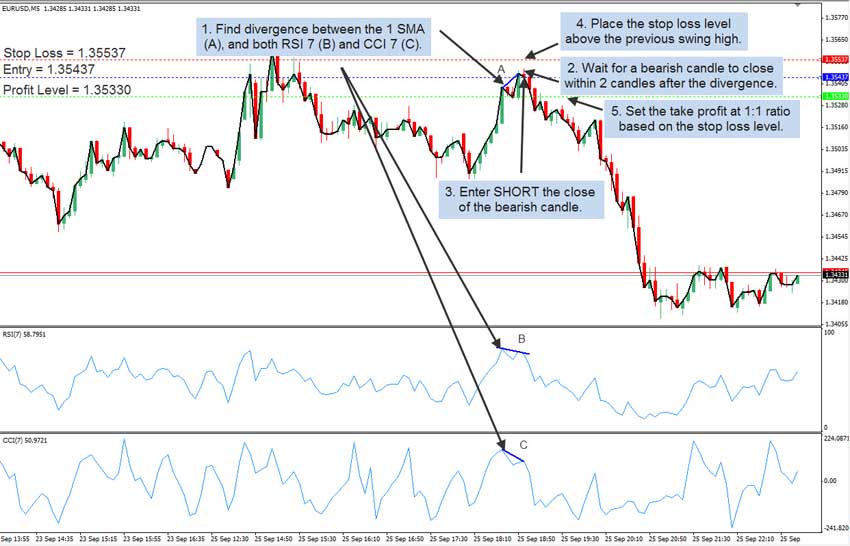
Here, we have another sell trade example. SMA 1 made a higher high (A) but the RSI 7 and the CCI 7 were making lower highs (B and C). This is a good bearish divergence signal.
The trigger candle appeared when a bearish formed. So as soon as it closed, I entered a sell trade at 1.35437. I then set the stop loss level above the highest high at 1.35537. I set my take profit approximately the same distance of the entry to the stop loss level, at 1.35330 which was easily achieved in 30 minutes. I got out of the trade with 10 pips of profit.
Conclusion
As you can see, my system is very simple, yet effective. You may notice that price can go much higher or lower than my targets, but I just use the system to scalp the markets. I like to be in and out of the market quickly. My system works best when the markets are ranging. So be careful when you see a strong trend, do not trade against it.
For you to trade successfully with the system, apply what you learned on a demo account for a long time until you know what you’re doing and you have some confidence. Find friends who are also traders and talk to them about your experiences. There may be things they know that may help you become better at trading. The forum is a great place to start.
I think that in trading, patience is very important. Do not jump in and out of trades without proper confirmation of the signals, or if you are already late. Wait for the next signal to come because you will have a better chance of winning the new trade than the missed setup.
Follow your plan, accept your losses and don’t overtrade when you lose.
So, that’s all for my system. Please don’t forget to watch the videos in the member’s area as I’m sure you will be able to learn more about my system from there as well.
 2 MACD Effortless Forex & Stocks Swing Trading Strategy
 MA COBRA Forex & Stocks Trading Strategy (Extremely Low Risk High Reward Trading Strategy) (COBRA SYSTEM)
 Forex and Crypto “MORNING TRADE” Trading Strategy for Advanced Traders
 FOREX 1 MIN Scalping Trading Tricks By The Most Successful Forex Trader
 Forex Trading Training : How to Use MACD Divergence Profitable Forex Strategy In 4 Easy Steps
 MACD RSI Trading – The Easiest Way To Measure Forex Reversal Breakouts
 Forex Profit Fusion – Learn How To Profit Foreign Exchange Markets in 30 Minute Time Frame
 Advanced Moving Average Forex Trading Tutorial – How To Become A Successful Forex Trader With Moving Average Indicator
 Top 10 Super Effective High Profits Forex Heiken Ashi Trading System and Strategy
 Foreign Exchange Trading : Online Forex Master Level Trading System and Strategy
