Trend and momentum indicators indicate different things for Forex and Stocks. Some indicators may be false indicators as they donot tell the true reason behind any rise or fall in prices of stocks or forex. It need experience and studies to accurately interpret the results.

There are various candle patterns/ trends which one can follow to identify the trend reversal. Some of them are explained here.
“Doji stars” – Prices at the open and close of the period are at the same level, indicating indecisiveness between bulls and bears. A Doji is quite often found at the bottom and top of trends and thus is considered as a sign of possible reversal of price direction.

“Stars” – Stars are reversal patterns and come in several different forms. The pattern consists of three candles, the first usually a large candle at the end of an extended trend followed by a smaller candle that leaves a gap or window and then another large body candle in the direction of the new trend. Large volume would help to confirm the reversal signal.
“Hammer” and “Hanging Man” – These two reversal patterns look very much alike, but their name and impact on prices depend on whether they occur at the end of a downtrend or an uptrend. The signal candlestick has a small real body and a long lower shadow, suggesting the previous trend is losing momentum. This pattern also requires confirmation by the next candle.

“Harami” – The harami is a reversal pattern following a trend. Rather than engulfing the previous candle, price action for the current candle is entirely within the range of the previous candle body. This pattern requires immediate follow-through for confirmation.
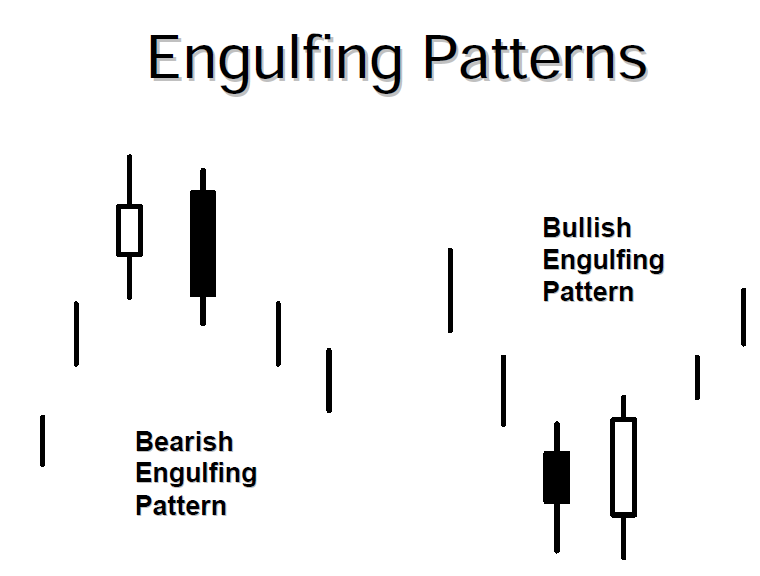
“Engulfing patterns” – Prices open below the previous close (bullish) or above the previous close (bearish) and then stage a strong turnaround, producing a candle body that totally engulfs the previous candle and suggesting a change in trend direction.
” Head n shoulders patterns” – Formation of the pattern:-
- Left shoulder: Price rise followed by a left price peak, followed by a decline.
- Head: Price rise again forming a higher peak.
- Right shoulder: A decline occurs once again, followed by a rise forming the right peak which is lower than the head.
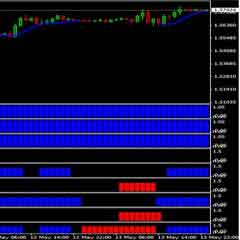
Trend Indicator
There is no better trend indicator than the Moving Averages (SMA, EMA). In fact, all the other trend indicators are based on moving averages. It is the oldest and still most popular trend indicator.
The best oscillators are: MACD, Stochastic and RSI.
I hope this was helpful!
 FREE DOWNLOAD 20+ Best Forex MACD-Moving Average Trading System
 TOP10 BEST Full Time Forex Trader Trading System and Strategy
 MA COBRA Forex & Stocks Trading Strategy (Extremely Low Risk High Reward Trading Strategy) (COBRA SYSTEM)
 High Profits and Super Effective FCP Forex Trading System (Forex Secret Protocol)
 FREE DOWNLOAD Top 10+ Best Forex Trading Systems for Beginners
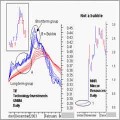 Stocks and Currency Trading With GUPPY Multiple Moving Averages Trading System
 Top 10 Forex ADX Trading System (High Accuracy ADX System)
 TOP 10 Best Bollinger Bands Forex Trading System and Strategy
 Top 10 Strategy to Build on Your Winning Forex Open Positions
 Forex & Stocks Trading Strategy with EMA-MACD Trend Dominator System
